
SLIDE 1
Stephen E. Brock, Ph.D., NCSP EDS 250: Gathering Research Data 1
1
Gathering Research Data
Stephen E. Brock, Ph.D., NCSP California State University, Sacramento
2
What is Quantitative “Data”?
The different types of data gathered as part of an empirical study are referred to as variables. All variables have at least two and often more values
- r scores.
Variables can be either categorical (e.g., eye color, gender) or quantitative (e.g., rankings, test scores). Variables take the form of at least one of four Scales of Measurement. Different scales require different types of statistical analysis. QUESTION: What is data in a qualitative study?
3
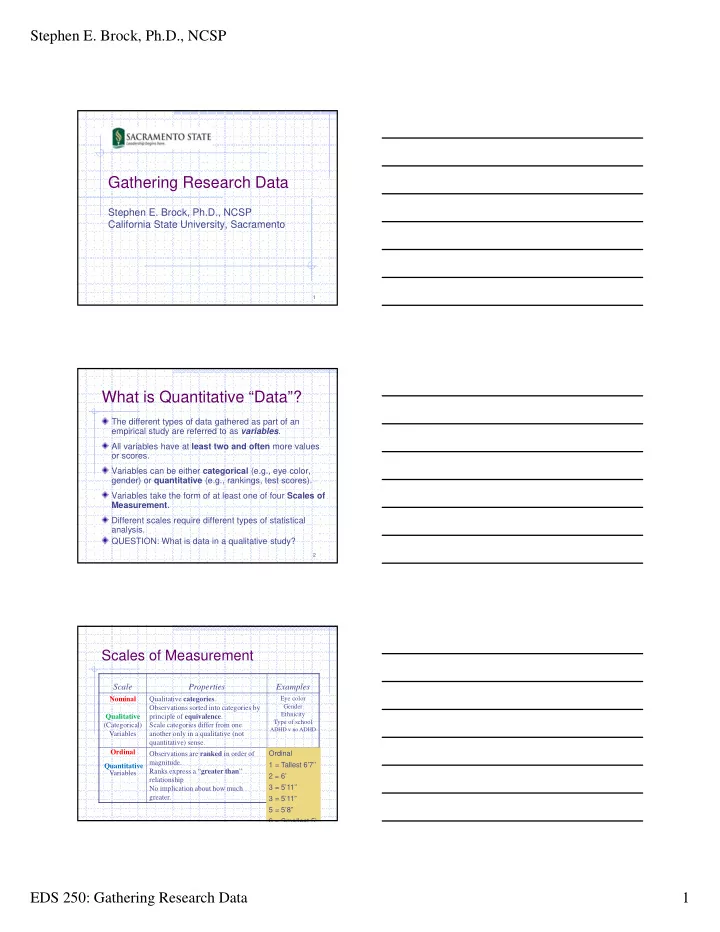
Scales of Measurement
Scale Properties Examples
Nominal Qualitative (Categorical) Variables Qualitative categories. Observations sorted into categories by principle of equivalence. Scale categories differ from one another only in a qualitative (not quantitative) sense.
Eye color Gender Ethnicity Type of school
ADHD v no ADHD
Ordinal Quantitative Variables Observations are ranked in order of magnitude. Ranks express a “greater than” relationship No implication about how much greater. Art skill level Grades Rankings Ordinal 1 = Tallest 6’7’’ 2 = 6’ 3 = 5’11’’ 3 = 5’11” 5 = 5’8” 6 = Smallest 5’