
SLIDE 1
Strictly confidential Sep 2017 Jun 2019
FY 2019 Final Results Presentation
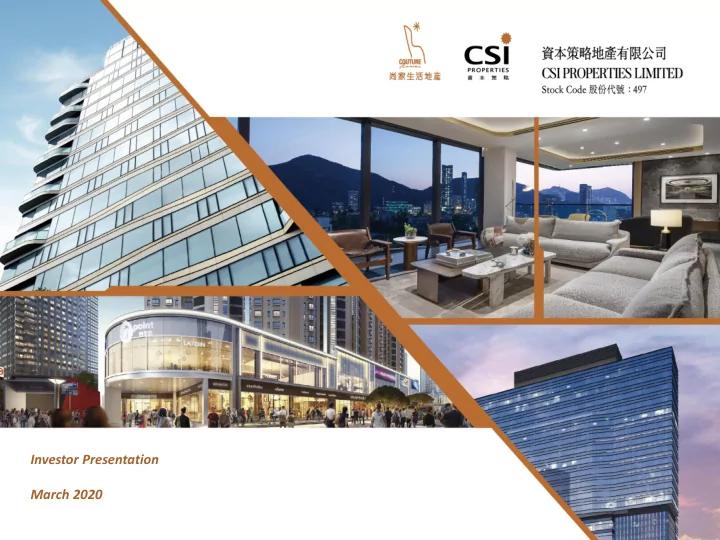
Investor Presentation March 2020
FY 2019 Final Results Presentation Jun 2019 Investor Presentation - - PowerPoint PPT Presentation
Strictly confidential FY 2019 Final Results Presentation Jun 2019 Investor Presentation March 2020 Sep 2017 DISCLAIMER The information contained in this presentation is provided by CSI Properties Limited (the " Company ") based on
Strictly confidential Sep 2017 Jun 2019
Investor Presentation March 2020
1
The information contained in this presentation is provided by CSI Properties Limited (the "Company") based on information available to it and does not constitute a recommendation regarding the securities of the Company and or its subsidiaries The information contained in this presentation has not been independently verified. In all cases, interested parties should conduct their own investigation and analysis of the information. No representation or warranty, expressed or implied, is made as to, and no reliance should be placed on, the fairness, reasonableness, accuracy, completeness or correctness of such information or
without notice. The Company undertakes no obligation (i) to amend or update this presentation to reflect any developments, whether actual or contemplated, and whether occurring before or after the date of this presentation; or (ii) to correct any inaccuracies in this presentation. None of the Company nor any of its affiliates, or any of its directors, officers, employees, advisers or representatives shall have any liability whatsoever (in negligence or otherwise) for any loss howsoever arising from any use of this presentation or its contents or otherwise arising in connection with this presentation/document. This presentation is based on the economic, regulatory, market and other conditions as in effect on the date hereof. It should be understood that subsequent developments may affect the information contained in this presentation, which neither the Company nor its advisers or representatives are under an obligation to update, revise or affirm. This presentation contains data sourced from and the views of independent third parties. In replicating such data in this document, the Company makes no representation, whether express or implied, as to the accuracy of such
with caution. Certain information contained in this presentation may constitute "forward-looking statements", which can be identified by the use of forward-looking terminology such as "may", "will", "should", "expect", "anticipate", "target", "project", "estimate", "intend", "continue" or "believe" or the negatives thereof or other variations thereon or comparable terminology. These forward-looking statements (if any) are based on a number of assumptions about the Company’s future operations and factors beyond the Company's control and are subject to significant risks and uncertainties, and, accordingly, actual results may differ materially from these forward-looking statements (if any). There may be additional material risks that are currently not considered to be material or of which the Company and its advisers or representatives are unaware. Against the background of these uncertainties, readers should not rely on these forward-looking statements. The Company undertakes no obligation to correct or update these forward-looking statements (if any) for any reason whatsoever. No statement in this presentation is intended to be or may be construed as a profit forecast or similar forecast or prediction of any kind. This presentation does not constitute nor form part of and should not be construed as, an offer to sell or issue or the solicitation of an offer to buy or acquire or sell or dispose of securities of the Company or any holding company or any of its subsidiaries or affiliates in any jurisdiction or an inducement to enter into investment activity. No part of this presentation, nor the fact of its distribution, shall form the basis of or be relied upon in connection with any contract or commitment whatsoever. The securities of the Company have not been and will not be registered under the U.S. Securities Act of 1933, as amended (the "Securities Act") or the securities laws of any state of the United States or other jurisdiction, and may not be offered, sold or delivered within the United States absent registration under or an applicable exemption from the registration requirements of the United States securities laws. This presentation and the information contained herein are being furnished to you solely for your information and may not be reproduced or redistributed to any other person, in whole or in part. In particular, neither the information contained in this presentation nor any copy hereof may be, directly or indirectly, taken or transmitted into or distributed in the United States, Canada, Australia, Japan, Hong Kong or any other jurisdiction which prohibits the same except in compliance with applicable securities laws. Any failure to comply with this restriction may constitute a violation of U.S.
By reviewing this presentation, you agree to be bound by the foregoing limitations and are deemed to have represented and agreed that you and any customers you represent are not located or resident in the United States as defined in Regulation S under the Securities Act.
2
Section 1 Key Strategies Highlights Section 2 1H FY2020 Financial Highlights Appendix 1 Prime Property Portfolio Review Appendix 2 Investment Highlights 3 11 24 45
Build Strong Recurring Income to Anchor EBITDA
1
Construct High Quality Real Estate Portfolio
2
Manage Disposal Pipeline to Recycle Capital & Crystalise Profit
3
Maintain Prudent Financing for Strong Asset Coverage & Liquidity
5 4
4
Source: Company information
1
1
generated steady recurring income stream to anchor EBITDA
2
and a high-street retail podium (In-Point mall) in Shanghai
3
the completion of Graham Street's 400,000 sqft Grade A
4
managed disposition of commercial & residential value- add/development projects can further drive aggregate
has reached HK$1,948m
281 307 302 113 100 200 300 400 FY17 FY18 FY19 1HFY20 (HK$m)
Rental Income
5
Source: Company information
2
Dukes Place in Jardine Lookout Luxury units on Peak Road Single House on Barker Road Villa collections on Fan Kam Road
Queen’s Gate Luxury villas & low-rise apartments in DaiHongqiao, Shanghai Beijing Legendale Luxury apartments in The Peninsula Beijing neighborhood
6
in top cities
Source: Company information
In-Point 四季汇 Wujiang Rd. Pedestrian Walk c.122k sqft Street-front Retail Richgate Plaza 华府天地 Xintiandi c.122k sqft Street-front Retail
2
7
46-48 Cochrane Street , Central
Commercial Redevelopment Harbourside HQ Kowloon East c.680K sqft Office Under renovation (CSI: 25%) Everest Building 241-243 Nathan Rd, Jordan
Source: Company information
SoHo PMQ Lan Kwai Fong Tai Kwun Heritage Complex MTR Station
46 Lyndhurst Terrace Remaining c.3k sqft GFA Renovated Comm’l Bldg. 2-4 Shelley St Remaining c.9.4k sqft GFA Completed Comm’t Bldg. 46-48 Cochrane St c.32k sqft GFA Comm’l Development Graham St/Gage St c.434k sqft GFA Comm’l Development (CSI: 50%) 92-96 Wellington St c.43k sqft GFA Comm’l Development
8
2
sold or entered into sales contracts
Source: Company information
3
9
7,200 7,842 1,950 1,539 5,000 10,000 15,000 20,000 Perpetual Capital Securities C2022
Bank Loans JV Commitments
Source: Company information Notes: (1) Cash and Equivalents (incl. Investment Securities) = Bank Balances and cash + Cash held by Securities brokers + Current and Non Current Financial assets at fair value through profit or loss (per CSI’s 2019/2020 interim report p12 and p339) (2) JV Commitments is detailed as per Note 25 Contingent Liabilities on p.42 of CSI’s 2019/2020 interim report
HK$ MM
As of 30 Sep 2019 Total Debt + Perpetual Notes Cash + Real Estate Assets at Market Value
4
HK$ MM
10
23,215 12,804 4,413
5,000 10,000 15,000 20,000 25,000 30,000 35,000 40,000 45,000
Cash & Equivalents (incl. Investment Securities) Residential Properties - Market Value Commercial Properties - Market Value
40,432 18,531
1 2
12
CSI recorded over HK$3.97 billion of sales (incl. JV/ Associates) this past interim and has an additional HK$1.31 billion of presales
% For the year ended 30 Sep 2019 HK$'000 Group level Hong Kong residential properties – Hong Kong commercial properties 2,609,472 Sub-total 2,609,472 Joint Ventures and Associates PRC residential properties 50% 32,645 Hong Kong commercial properties 30% 1,331,166 Sub-total 1,363,811 Total 3,973,283 Less: Non-controlling interests – Contracted sales attributable to the Group 3,973,283
12
Note: * Unrecognised contracted sales committed up to 30 Sep 2019 is at approximately HK$1,307,259,000 and is detailed on p.47 of CSI’s 2019/2020 interim report
CSI has recognized a few key disposals within 1H FY2020 to ensure good profitability
Notes: * All disposal prices accounted at CSI’s attributable stake ownership ** COO Residence units were presold during construction period at Sep/ Oct 2017 with units delivery and booking set for approximately March 2020
Date completed Projects sold and booked 1H FY2019 Location Sep 2019
Tsim Sha Tsui Aug/Sep 2019 3 villas for Queen’s Gate project in DaiHongQiao in Shanghai (CSI-50%) Shanghai Jul/Aug 2019
Kowloon Bay Apr 2019 13 upper office floors of Nos. 2-4 Shelley Street new commercial tower Central Date Presold Projects presold for future bookings Location Jan 2020 One unit of Dukes' Place at 47 Perking Road (CSI-60%) Jardine's Jul 2019 to Jan 2020 23 villas and 87 apartments for Queen’s Gate project in DaiHongQiao in Shanghai Shanghai (CSI-50%) Sep/Oct 2017 COO Residence in Tuen Mun (booking set for approximately Mar 2020)** Tuen Mun
13
Source: Company information
in the site during the first half of fiscal year 2020
site into a brand new contemporary, commercial building with total GFA
commence in early 2020 with new building completion anticipated around end of 2023
92, 94 & 96 Wellington Street, Central
CSI has acquired site Nos. 92, 94&96 Wellington Street in Central for c.HK$666m
14
(Period ended 30th Sep) (HK$m) 1H FY2020 (A) 1H FY2019 (B) % change (A/B-1) Gross revenue from property business 2,722 2,446 11% Property sale 2,609 2,296 Rental income 113 150 Gross profit 1,387 730 90% Profit from property JV/associates 415 39 954% Profit attributable to equity holders 1,474 352 319% EPS (basic) 14.98 cents 3.50 cents 328%
15
Strong balance sheet and liquidity to ensure financial stability
(HK$m) 1H FY 2020 30th Sep 2019 FY 2019 31st Mar 2019 Properties & related assets 22,169 21,922 Cash & bank balances (including cash held by securities brokers) 2,500 1,410 Investments 1,913 2,092 Other assets 738 905 Total assets 27,320 26,329 Bank loans 7,842 8,428 Guaranteed notes 1,950 1,950 Other liabilities 2,721 2,337 Total liabilities 12,513 12,714 Common stock equity 13,230 12,037 Non-controlling interests 38 38 Perpetual capital securities 1,539 1,540 Total equity 14,807 13,615
16
Notes: (1) Properties & related assets = Properties held for sale + Property, plant and equipment + Interests in joint venture +Amounts due from joint ventures + Interests in associates + Amount due from associates + Contract costs
Properties valued at historical cost basis on book with no revaluation surplus. Even after revaluation adjustment, it still represents significant value in terms of a significant discount to pro forma adjusted NAV
Notes: (1) Based on latest open market valuations at Sep 30, 2019 carried out by independent firms of qualified professional valuers not connected to the Group (value adjusted slightly due to RMB – HK$ exchange rate changes) or latest transactions and prices (2) Deferred tax liabilities have not been provided for the attributable revaluation surplus of properties held for sale (3) NAV per share calculated based on 9,808 million shares in issue as at 30 Sep 2019
Net asset value (unaudited) (HK$m) Net assets attributable to shareholders (FY2019, audited) 13,230 Add
September 20191 5,385
independent valuations at 30 September 20191 1,528 Net assets attributable to shareholders as if properties held for sale by jointly controlled entities and interests in jointly controlled entities were stated at open market value2 20,143 Pro-forma adjusted NAV per share3 HK$2.05
17
Key credit metrics 1H FY 2020 (HK$m) FY 2019 (HK$m) FY 2018 (HK$m) EBITDA1 / interest expenses2 11.6x 2.9x 4.2x Net debt / total assets (net gearing ratio) 26.7% 34.1% 29.9% Net debt / adjusted total assets3 21.2% 25.6% 23.3% Net debt plus commitment to JVs /adjusted total assets plus JV assets4 33.6% 38.3% 34.6%
Notes: (1) EBITDA is calculated as profit before taxation adjusted for fair value changes, impairment loss on available-for-sale investments, impairment loss on properties held for sale, gain on disposal of property, plant and equipment, gains on de-recognition of investments in convertible notes, interest income, finance cost, income from amortisation of financial guaranteed contracts and depreciation of property, plant and equipment (2) Including capitalised interest (3) Adjusted total assets equals total assets plus revaluation surplus (4) Adjusted total assets plus JV assets equals total assets plus revaluation surplus and JVs attributable assets
18
FY 2019 margins have been affected by a few sizeable and more immediate turnaround transactions
Reported net profit 2 EBITDA and EBITDA margin 1 Gross profit and gross profit margin Revenue
Notes: (1) EBITDA is calculated as profit before taxation adjusted for fair value changes, impairment loss on available-for-sale investments, impairment loss on properties held for sale, gain on disposal of property, plant and equipment, gains on de-recognition of investments in convertible notes, interest income, finance cost, income from amortisation of financial guaranteed contracts and depreciation of property, plant and equipment
19
(2) Attributable to owners of the Company (3) Include the gains on disposal of property, plant and equipment
1,587 3,662 3,137 2,296 2,609 281 307 302 149 113 1,868 3,969 3,439 2,446 2,722 1,000 2,000 3,000 4,000 FY2017 FY2018 FY2019 1H FY2019 1H FY2020 (HKDm) Property Sales Rental 601 859 1,065 730 1,387 32% 22% 31% 30% 51% 0% 10% 20% 30% 40% 50% 60% 500 1,000 1,500 2,000 FY2017 FY2018 FY2019 1H FY2019 1H FY2020 (HKDm) Gross profit Margin 1,347 1,010 530 352 1,474 72% 25% 15% 14% 54% 0% 20% 40% 60% 80% 1,000 2,000 3,000 FY2017 FY2018 FY2019 1H FY2019 1H FY2020 (HKDm) Net profit attributable to the Company Profit margin 1,531 3 1,340 1,067 774 1,948 1,000 2,000 3,000 FY2017 FY2018 FY2019 1H FY2019 1H FY2020 (HKDm)
5.7x 4.2x 3.0x 11.6x 1.7x 1.9x 0.7x 0.7x 2 4 6 8 10 12 14 FY2017 FY2018 FY2019 1H FY2020 (x) EBITDA / net interest expense Cash / short-term debt
Debt / total assets Debt / total equity EBITDA1 / net interest expense2 and cash3 / short-term debt Debt / EBITDA1
*FY19 cash+ securities / short term debt is 1.63x
Notes: (1) EBITDA is calculated as profit before taxation adjusted for fair value changes, impairment loss on available-for-sale investments, impairment loss on properties held for sale, gain on disposal of property, plant and equipment, gains on de-recognition of investments in convertible notes, interest income, finance cost, income from amortization of financial guaranteed contracts and depreciation of property, plant and equipment (2) Net interest expense equals total interest paid net of interest income (3) Cash includes bank balances and cash 7.0x 7.7x 9.7x 5.0x 4.7x 5.8x 8.5x 4.7x 2 4 6 8 10 12 FY2017 FY2018 FY2019 1H FY2020 (x) Total debt / EBITDA Net debt / EBITDA 100.3% 87.7% 86.2% 74.0% 66.8% 65.7% 74.5% 55.1% 0% 20% 40% 60% 80% 100% 120% FY2017 FY2018 FY2019 1H FY2020 (%) Total debt / total equity Net debt / total equity 46.8% 39.8% 39.4% 35.8% 31.2% 29.9% 34.1% 26.7% 0% 20% 40% 60% FY2017 FY2018 FY2019 1H FY2020 (%) Total debt / total assets Net debt / total assets
20
21
US$200m
agreement for a total loan amount of HK$2.0 billion
Total Bank Borrowings at HK$ 7,842 million and Its Breakdown (HK$ ’million)
development projects
addition to several project loans at attractive terms to lengthen our debt profile and increase liquidity
Within 1 YR 3,626 46% Between 1-5 YR 4,216 54%
Bank Borrowing Profile as at Sep 30, 2019
Note: (1) As of 31 March 2019 (2) As of 30 September 2019
Diversified funding sources ¹
21
Prudent funding and treasury policy
Dividends
general economic and business conditions and also peer group norms Leverage
Liquidity
Prudent leverage policy coupled with rich cash resources puts CSI in a favourable position to capitalise on viable and strategic acquisition opportunities
Notes: (1) EBITDA is calculated as profit before taxation adjusted for fair value changes, impairment loss on available-for-sale investments, impairment loss on properties held for sale, gain on disposal of property, plant and equipment, gains on de-recognition of investments in convertible notes, interest income, finance cost, income from amortization of financial guaranteed contracts and depreciation of property, plant and equipment (2) Total interest expense includes finance costs plus capitalised interest (3) Cash includes bank balances, cash and cash held by securities brokers as at 30 Sep 2019
22
Gross area sq.ft.
1 (000s)
(approx) Market value
1, 2
(HK$m) Book value
1
(HK$m)
G/F, 51 carparks of Capital Centre (formerly AXA Centre) Wan Chai 17 823 150 Novotel Hotel, No. 348 Nathan Road Jordan 220 4,230 2,727
Central 9 630 258 In Point, No. 169 Wujiang Road & No. 1 Lane 333 Shimen Road Jing’an District, Shanghai 122 1,952 572 2 Floors of Broadway Center (CSI–60%) Macau 9 194 192
Kowloon Bay 295 4,751 2,000
Central 32 480 480 Level 1, level 2 and basement level 1, No. 1-6, Richgate Plaza Lane 222, Madang Road Huangpu District, Shanghai 122 2,135 1,580 2 shops of Oriental Crystal Commercial Building Central 3 238 132 Lai Sun Yuen Long Centre (CSI-50%) Yuen Long 388 1,700 1,037 Gage Street Commercial site in Central (CSI – 50%) Central 434 11,160 10,859 Everest Building, Nos. 241and 243 Nathan Road Jordan 62 1,776 1,776 Harbour side HQ, No.8 Lam Chak Street (CSI – 25%, formerly known as OCTA Tower) Kowloon Bay 680 8,000 7,560
Central 43 980 666 Sub-total 2,436 39,049 29,989
Gross area sq.ft.
1 (000s)
(approx) Market value
1,2
(HK$m) Book value
1
(HK$m)
The Peak 4 1,000 460 Queen's Gate, villas in Dahongqiao (CSI–50%) Daihongqiao, Shanghai 57 1,300 601 Dukes Place, No. 47 Perkins Road (CSI–60%) Jardine's Lookout 58(3) 4,312 2,398 COO Residence, No. 8 Kai Fat Path Tuen Mun 113(3) 1,645(4) 917 Land Lot No. 1909 in D.D. 100, Fan Kam Road (from government tender) (CSI–92%) Sheung Shui 33 880 620 18 residential units and 1 house at 8-12 Peak Road (for refurbishment) (CSI–65%) The Peak 44(3) 3,538 2,331 Maryknoll House site, No. 44 Stanley Village Road (CSI – 50%) Stanley 34(3) 1,450 964 Beijing Legendale, Dongcheng District (CSI – 65%), 114 Apartments +124 Carparks Beijing 396 3,924 2,247 Construction site at New Kowloon Inland Lot No. 6602 (CSI – 20%) Yau Tong 325 2,681 2,681 Sub-total 1,190 20,730 13,219
Commercial properties Residential properties
Notes: Based on 100% ownership interest (1) Gross area, market value, book value, current/committed annual rent on 100 per cent. interest basis (2) Market value was based on valuation reports conducted by independent qualified valuers subsequent to year ended 31 Mar 2019 or transaction price (3) Saleable area applied. (4) Market value was based on the actual transaction price.
23
Key prime commercial assets in Hong Kong and Shanghai helps to anchor the Group’s rental income annually Novotel Hotel – Jordan Richgate Plaza – Shanghai The Harbourside HQ (previously OCTA Tower) – Kowloon Bay In Point – Shanghai
Everest Building – Jordan
26
Prime commercial assets under management in Central at GFA of 400,000+ sq.ft., anchoring Group’s future profit pipeline
The Center
GFA to sell
Oriental Crystal Building, 46 Lynhurst Terrace
Commercial redevelopment site with GFA of c.43K sq.ft.
92-96 Wellington St.
tender with GFA of c. 434k sq.ft. to be developed into office and hotel towers
Gage St./ Graham St.
46-48 Cochrane Street, Central
floors and lower F&B floors remaining to be sold soon (c. 9.4K GFA)
2-4 Shelley Street
27
Street/Graham Street project from the Urban Renewal Authority (“URA”), and our first URA tender project
(0369.hk), a solid real estate company in Hong Kong
Central financial hub
Foster+ Partners, we have initiated the master planning process for this grand project which comprises of a c. 300,000 sq.ft. Grade A office tower and a c.100,000 sq.ft. super luxury hotel tower. The architectural design will combine vernacular architecture and materiality together with high-tech futurism to create a new iconic landmark in this area rich with history yet undergoing transformation in Central/SOHO
Gravity in the vicinity to attract a mixed programme of business, retail, education, local flavor and high-end hospitality, attracting occupants from leading new and
travelers
anticipated in 2023 The Center
URA Tender won for Gage Street and Graham Street site marks a new landmark for the Group
28
shops and rooftop of this office building in Central/SOHO for a consideration of c. HK$700 million for GFA of around 43,000 sq.ft.
the value appreciation for this prime address nearing completion
HK$20K+ psf.) to buyers including end users/ investors
(GFA c.3k sq.ft.) in the near future at this prime central/ SOHO address
In-point Shopping Mall
29
total GFA of over 40,000 sq.ft. (CSI - 100%)
escalator, and still within minutes of the Central CBD
tenants) to be sold in near future (remaining GFA c. 9K sq.ft.)
and right next to Hollywood Road, within 5 minutes walking distance of Central MTR Station (CSI - 100%)
in 2022
Central Police Station Revitalization Project by HK Jockey Club) next door
2-4 Shelley Street, Central (Sale in Progress) 46-48 Cochrane Street, Central
29
30
Our Property : Nathan Rd 348 MTR Express Rail Link Eaton Hotel The Mira Hotel
prime Nathan Road
50% stake for HK$1.56 billion in 2015
flagship office/ retail of GFA of 250,000 sq.ft.
Novotel Hotel Jordan
31
consortium arrangement (CSI -25%) in Aug 2018
Nan Fung office tower and also future transportation link as per town planning
glass curtain wall, external façade and office floors while keeping the existing tenants
and rental yield to maximise value for potential future disposal
high paying tenants including banking middle office, TMT hubs after the renovation to improve rental yields
big landlords in Kowloon Bay CBD2 (CSI - 30%) at Wai Yip Street
490,193 sq.ft.
East Kowloon
Terminal
sell
38 Wai Yip Street Office Tower The Harbourside HQ (previously OCTA Tower)
32
busiest business spots in Kowloon. Total GFA is approximately 62,000 sq.ft.
also mid-tier office/ commercial tenants on higher floors
repositioning of the building via changing tenant mix to becoming a new beauty and medical-themed building, we believe the prime location of this building will drive significant value creation
Everest Building (Grade B office/retail repositioning)
32
33
this industrial building with GFA of 388K sq. ft. for revitalization
new lease rental reversion is expected to be much higher per sq. ft.
possible redevelopment
Yuen Long Industrial Building (Mixed Commercial Use Conversion)
Dated industrial building Preliminary conversion rendering Long Ping MTR station (3 mins walk) Yuen Long MTR station (5 mins walk)
34
Taikoo Hui Swire-HKRI Dazhongli Project Four Seasons Hotel
at approximately HK$1,952 million
and attracting strong rental
into double-decker premium street front stores to attract top brand retail tenants within this heavy retail area
In-Point Shopping Mall
34
35
Xintiandi area for a original total consideration of RMB 1.37 billion with total GFA
premium brand tenants, we believe the prime location of this retail mall will drive significant value creation
Richgate Plaza
project at the Jardine’s Lookout - a quiet ultra high net-worth neighborhood
layouts, with saleable area ranging from approx. 2,800 sq.ft. to over 6,800 sq.ft.
the U.K., France, Japan and Hong Kong, units will capture the heritage of Jardine’s Lookout, while incorporating unique lifestyles and elements from these master-class designers
WORLD CLASS LUXURY APARTMENTS IN JARDINE’S LOOKOUT
36
37
Peak Road Project
OPUS Hong Kong (Highest Unit Rate @c. $100k) back in 2016 Interocean Court Mount Nicholson (Highest Unit Rate @$130k+)
Oct 2015 at HK$1.8 billion
valuation premium at this super prime site with unmatched Victoria Harbor view
Precious Residential Development with Victoria Harbour seaview
38
(All residential units sold) Luxurious High-Rise in Tuen Mun
and the Traditional Tuen Mun Town Centre being the very heart of the city.
presold for a total of approximately HK$885mn
after tenants occupation
38
39
MTR tender in May 2018 a residential site at Yau Tong at the total consideration of approximately HK$2.6bn. +
developed into a saleable GFA of around 325K Sq.ft..
construction work to commence soon after approvals
40
The Finest Expression of British Elegance
named as Queen’s Gate and only 15 minutes driving distance from the new Hong Qiao International Airport
apartment units
near future
41
JinBao Street.
interior of residential units to modern designs
with sales to commence
42
the Peak
completed
43
– Luxurious Manor Site in Kwu Tung South
Fan Kam Road Project
Hong Kong Golf Club
Properties in 2015 and is a very rare manor site next to the Hong Kong Golf Club and Beas River Country Club of The Hong Kong Jockey Club.
extremely convenient to travel from the site to business
with 6,000 square feet with enormous garden and private swimming pools
sales to follow
43
44
Stanley for a consideration of c. HK$780 million for the site of around 82,300 sq.ft.
residential area in Stanley with stunning seaview of Stanley Bay
authorities on the preservation plan for this site for which the rezoning plan has been approved pending gazette
46
Generated Average IRR of
by Applying the Proven Strategy
Real Estate Professionals
FinanceAsia (2018)
Applied Proven Strategy of “Buy-Fix-Sell” to a Portfolio of
Leading HK-based Mid-Cap Property Investor and Developer
Prime Commercial and Residential Land Bank in Hong Kong and Tier 1 Cities in China
Net Assets
7 9 12 21 25 25 34 42 60 71 78 83 97 108 117 120 20 40 60 80 100 120 FY04 FY05 FY06 FY07 FY08 FY09 FY10 FY11 FY12 FY13 FY14 FY15 FY16 FY17 FY18 FY19
2016
successfully issued 250 million USD new bond in August 2016 2004
focusing on Repositioning and Value Enhancement of Commercial Properties in Prime Hong Kong locations 2010
lifestyle residential division under “ Couture Homes” brand
HK$3.4 billion
30 people 2015
“Best Luxury Residential Development (HK & Macau)” in China Property Awards 2015
“Best Luxury Residential Development (Shanghai)” in China Property Awards 2015
2019 Over 20 prime commercial and residential projects in Hong Kong and Shanghai
2013
Small Cap Company” by FinanceAsia
(100 million HKD)
2006
International Capital Plaza in Prime Shanghai
Chung’s takeover 2012
Hampton in Happy Valley
2014
The annual growth rate for 2004-2017 fiscal year increase at c.23%
Since the inception at 2004, CSI has evolved from an asset trading focused property company to becoming a solid, mid-cap full service real estate investor / developer with 5 major lines of business
Commercial properties
Commercial redevelopment and
repositioning at prime locations like Central Greenfield development of prime commercial properties at prime locations Strong rental generating commercial assets at prime locations
Couture Homes
Super luxury and luxury residential products targeting Super HNWs and HNWs Mass market design-oriented residential targeting young and hip audience
Become the leading mid-cap HK real estate company with steady profitability and dividend policy Young, high growth company with passionate and experienced management team
Proven profitability for our properties with all cash profit only and no revaluation gain with stable profitability
Net profit1
FY09: 62 FY12: 1,754 FY15: 263 FY18: 1,010 FY10: 546 FY13: 903 FY16: 1,645 FY19: 530 FY11: 858 FY14: 815 FY17: 1,347
1HFY20: 1,474
1,000 2,000 3,000 4,000 FY09-11² FY12-14 FY15-17 FY18-YTD (HK$m)
2H FY20 to come
Notes: (1) Attributable to owners of the Company (2) Profit for FY 09 was lower due to financial crisis (3) Profit for FY 15 was lower due to Occupy Central Movement (4) Profit for FY 19 was lower as Shelley Street office floor booking changed to Apr/ May 2019
Steady dividend policy at c. 12-15% of net profit
Dividend payout
15.8 40.8 82.3 204.0 131.0 106.0 66.1 198.0 162.6 140.0 70.6 50 100 150 200 250 Mar-09 Mar-10 Mar-11 Mar-12 Mar-13 Mar-14 Mar-15 Mar-16 Mar-17 Mar-18 Mar-19 (HK$m) HK$100m share buyback HK$115m share buyback HK$99m share buyback
Notes: (1) CSI spent c. HK$99m for share repurchases in April 2019 (2) Mico Chung also bought shares in open market to increase his stake to 47.9% in Feb 2017 and to 49.9% in April 2018
securities issue arranged by DBS, HSBC, JP Morgan and UBS etc. to raise US$200 million in September 2017 at an attractive coupon rate of 5.75%
mid/small cap Hong Kong real estate company, marking investors’ confidence in the credit and financial strength for the Group
bond issue in 2016, which also gathered strong interest from both institutional and private bank investors, to help raise capital for the Group
financing options for the Group and allows more flexibility in financing our future growth, while also giving us access to a broader investor base of global fixed income investors
Selected projects and returns
Projects Months of holding IRR (%)
B/F Ginza Plaza, Macau 3 171 11/F – 23/F Henan Building, Wanchai 13 70
7 47 CUBUS, Causeway Bay 64 43 Golden Center, Sham Shui Po 20 26 H8, Tsim Sha Tsui 85 25 The Platinum, Shanghai 65 19
338 496 47% 821 1,029 25% 499 1,530 207% 523 665 27% 234 288 23% 328 668 104% 2,150 3,456 61%
Cost (HK$m) Selling price (HK$m)
Source: Company information
Group senior management
Mico Chung Chairman, Founder and Executive Director
(Holdings) Limited and was previously a non-executive director of PCCW Limited
Corporation International, China Strategic Holdings Limited and PCCW Limited
– HK$1.72 billion acquisition of World Trade Centre from Hongkong Land (1990) – Spin-off of Pacific Century Premium Development from PCCW – Acquisition by PCCW of HKT – Inception of the Cyberport project
and qualified as a solicitor in Hong Kong in 1986 Simon Kan Chief Operating Officer and Executive Director
Brown JSM and also as legal counsel for China Oil and Gas Group
Hong Kong in 1997 Louis Chow Chief Financial Officer and Executive Director
Institute of Certified Public Accountants
Hong Kong Polytechnic University
Commercial Property
Bernard Lau Managing Director
Lehman Brothers and Nomura International’s principal real estate investment in Greater China and also as regional director of acquisitions for Greater China at LaSalle Investment Management
Management from Yale University Barry Ho Deputy Managing Director
analyzing market data and trends
Ethan Wong Senior Director, Acquisition & Investment
Vietnam, Singapore, and United States
California, Berkeley, a MBA degree from Carnegie Mellon University, and a Master of Laws from the Open University
Wong Chung Kwong Consultant
management
and the PRC Paul Ogden Managing Director
Kong, including more recently leadership roles in WeWork
(HKIS) and holds an Estate Agency Authority (EAA) Salesperson license
Couture Homes ("CH")
Jimmy Fong Execution Director of CSI and Managing Director of Sales and Marketing of CH
knowledge of the property market Anthony Fok Head of Design
commercial developments Victor Chiu Senior Project Director
residential and commercial property developments in Hong Kong, Macau and Shanghai
Barry Chan Senior Project Director
management
development
“Asia’s Business Leaders” by CNBC Asia in 2014
in Hong Kong” for 2018 and “Best Small–cap Company in Hong Kong” for 2013 and 2014 in Asia’s Best Managed Companies annual poll conducted by FinanceAsia, the leading financial journal in the Asia Pacific region
investment community in the Group's business strategy and track record during the past decade
projects also received numerous awards and wide industry recognition, a true reflection of the strength of our management's leadership and deliveries
2013, 2014
2018 Best Mid-cap
Current shareholding overview1
shareholder indicating confidence in the future growth prospect of CSI
to over 51.1% from 49.9% as a result of open market share purchase by CSI in Apr 2019
managers also helps to drive valuation and growth
Mico Chung 51.1% Value Partners 6.9% Dalton Investments 5.0% Fidelity International 5.1% Dimensional Fund 2.4% Others 29.5%
Source: Company information, Bloomberg as 10 Feb 2020 Notes: (1) Based on 9,808 million shares currently outstanding (2) Others key funds include Blackrock/Janus Henderson/Schroders/Mass Mutual/State Street
2013 & 2014 2018
Best HK Mid-Cap Company