SLIDE 4 3/21/2017 4
Watertown High School
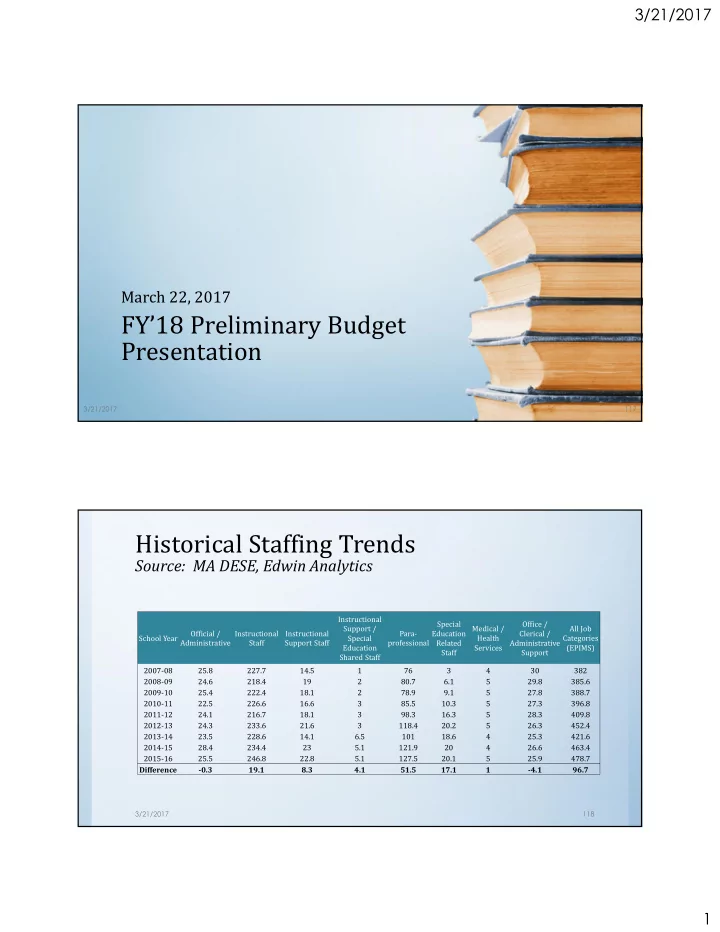
FY’18 Preliminary Budget Summary
3/21/2017 123
Category FY2014 Actual Expended FY2015 Actual Expended FY2016 Actual FTE FY2016 Actual Expended FY2017 Current FTE FY2017 Revised Budget FY2018 Level Svc FTE FY2018 Level Svc Budget FY2018 Preliminary FTE FY2018 Preliminary Budget % Change (17 to 18) SALARY 5,485,990 5,916,815 96.2 6,257,318 108.5 6,735,621 108.5 7,258,827 110.1 7,414,733 10.1% ART 162,836 167,951 2.0 169,652 2.0 172,103 2.0 180,540 2.0 180,540 4.9% BUSINESS 66,677 72,287 1.0 79,455 1.0 82,236 1.0 89,770 1.0 89,770 9.2% ENGINEERING
66,900 1.0 67,414 1.0 67,414 0.8% ENGLISH LANGUAGE ARTS 430,347 492,432 8.0 539,119 8.2 534,842 8.2 611,493 8.2 615,288 15.0% FACILITIES 192,311 200,070 4.5 179,230 4.5 232,736 4.5 211,043 4.5 211,043
FAMILY & CONS SCIENCE 76,779 82,533 1.0 87,667 1.0 87,668 1.0 92,433 1.0 92,433 5.4% GENERAL EDUCATION 54,817 31,638
1.0 33,083 1.0 55,713 1.0 55,713 68.4% INDUSTRIAL TECHNOLOGY 164,591 168,977 1.0 80,258 1.0 80,258 1.0 84,370 1.0 84,370 5.1% INSTRUCTIONAL TECHNOLOGY 26,338
82,820 1.0 88,909 1.0 97,511 1.0 97,511 9.7% INTERSCHOLASTIC SPORTS 334,125 362,599
365,657 0.2% LIBRARY/MEDIA 29,170 59,193 3.0 87,843 3.0 91,744 3.0 105,598 3.0 105,598 15.1% LITERACY 28,510
MATH 542,104 590,070 10.2 611,665 9.2 687,405 9.2 704,513 9.2 704,513 2.5% MUSIC 51,146 78,595 1.0 80,808 1.0 80,808 1.0 84,870 1.6 122,630 51.8% MUSIC/DRAMA ACTIVITIES 15,942 16,420
19,141 10.1% OT/PT 168 12,086 0.5 29,356 0.6 37,473 0.6 39,600 0.6 39,600 5.7% PHYSICAL EDUCATION & HEALTH 258,087 243,322 4.0 255,381 4.6 298,697 4.6 283,099 4.6 283,099
PSYCHOLOGICAL SERVICES 82,409 86,496 1.0 57,392 1.0 60,329 1.0 64,820 1.0 64,820 7.4% SCHOOL LEADERSHIP 517,098 513,351 6.0 467,962 6.0 466,166 6.0 500,859 6.0 511,336 9.7% SCIENCE 408,477 407,574 7.0 487,652 7.0 498,091 7.0 531,776 7.0 540,156 8.4% SOCIAL STUDIES 497,722 478,688 6.0 459,623 6.0 466,481 6.0 502,742 6.0 502,742 7.8% SPECIAL EDUCATION 1,025,652 1,389,117 32.0 1,610,548 42.0 1,769,311 42.0 1,926,548 43.0 2,032,414 14.9% SPEECH & LANGUAGE 77,714
76,613 1.0 76,613 0.0% STUDENT ACTIVITIES 27,558 56,675
68,008 20.1% TESTING & ASSESSMENT 68,080 71,365 1.0 75,355 1.0 78,253 1.0 64,449 1.0 64,449
WORLD LANGUAGE 347,332 335,376 5.0 349,435 5.4 383,214 5.4 419,875 5.4 419,875 9.6%
Watertown High School FY’18 Preliminary Budget Summary
Category FY2014 Actual Expended FY2015 Actual Expended FY2016 Actual FTE FY2016 Actual Expended FY2017 Current FTE FY2017 Revised Budget FY2018 Level Svc FTE FY2018 Level Svc Budget FY2018 Preliminary FTE FY2018 Preliminary Budget % Change (17 to 18) NON-SALARY 773,090 196,002
618,092 55.1% ART 5,239 5,302
8,325
BUSINESS
1,050 0.0% ENGINEERING
9,150 34.8% ENGLISH LANGUAGE ARTS 3,254
8,484
FACILITIES 430,254
FAMILY & CONS SCIENCE 4,180 296
5,214 10.0% GENERAL EDUCATION 12,299 48,823
48,737 12.2% INDUSTRIAL TECHNOLOGY 6,217
8,215 14.7% INSTRUCTIONAL TECHNOLOGY
0.0% INTERSCHOLASTIC SPORTS 240,015 87,351
201,066
LIBRARY/MEDIA 8,345 675
8,915 18.6% LITERACY
250 0.0% MATH 2,730
0.0% MUSIC 1,119 2,570
14,700 40.0% MUSIC/DRAMA ACTIVITIES 513 1,001
11,350 2.3% OT/PT
6,000 0.0% PHYSICAL EDUCATION & HEALTH 2,582
6,226
SCHOOL LEADERSHIP 25,428 31,353
41,030 65.9% SCIENCE 5,749
60,699 1464.0% SOCIAL STUDIES 1,916
23,875 3981.2% SPECIAL EDUCATION 2,121
13,571 0.5% SPEECH & LANGUAGE
STUDENT ACTIVITIES 19,112 17,026
24,300 13.8% WORLD LANGUAGE 2,018 1,540
3,900
Grand Total 6,259,080 6,112,817 96.2 6,579,824 108.5 7,134,233 108.5 7,678,155 110.1 8,032,825 12.6%
3/21/2017 124