SLIDE 1 FULL YEAR RESULTS FOR THE YEAR ENDED 31 MARCH 2016
LondonMetric Property Plc 1
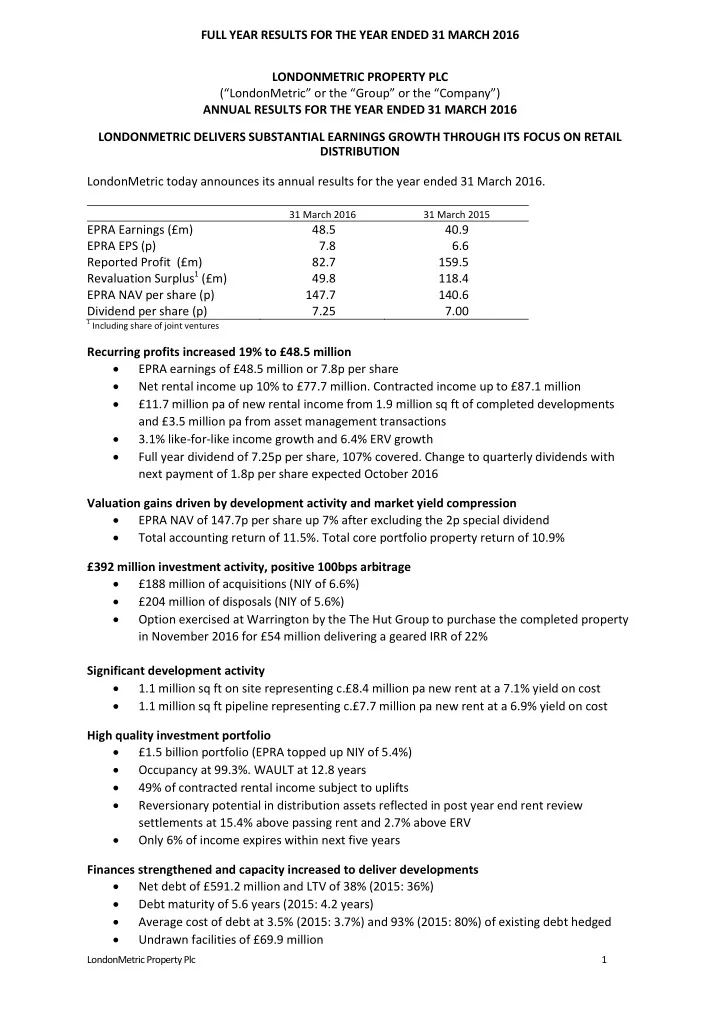
LONDONMETRIC PROPERTY PLC (“LondonMetric” or the “Group” or the “Company”) ANNUAL RESULTS FOR THE YEAR ENDED 31 MARCH 2016 LONDONMETRIC DELIVERS SUBSTANTIAL EARNINGS GROWTH THROUGH ITS FOCUS ON RETAIL DISTRIBUTION LondonMetric today announces its annual results for the year ended 31 March 2016.
31 March 2016 31 March 2015
EPRA Earnings (£m) 48.5 40.9 EPRA EPS (p) 7.8 6.6 Reported Profit (£m) 82.7 159.5 Revaluation Surplus1 (£m) 49.8 118.4 EPRA NAV per share (p) 147.7 140.6 Dividend per share (p) 7.25 7.00
1 Including share of joint ventures
Recurring profits increased 19% to £48.5 million EPRA earnings of £48.5 million or 7.8p per share Net rental income up 10% to £77.7 million. Contracted income up to £87.1 million £11.7 million pa of new rental income from 1.9 million sq ft of completed developments and £3.5 million pa from asset management transactions 3.1% like-for-like income growth and 6.4% ERV growth Full year dividend of 7.25p per share, 107% covered. Change to quarterly dividends with next payment of 1.8p per share expected October 2016 Valuation gains driven by development activity and market yield compression EPRA NAV of 147.7p per share up 7% after excluding the 2p special dividend Total accounting return of 11.5%. Total core portfolio property return of 10.9% £392 million investment activity, positive 100bps arbitrage £188 million of acquisitions (NIY of 6.6%) £204 million of disposals (NIY of 5.6%) Option exercised at Warrington by the The Hut Group to purchase the completed property in November 2016 for £54 million delivering a geared IRR of 22% Significant development activity 1.1 million sq ft on site representing c.£8.4 million pa new rent at a 7.1% yield on cost 1.1 million sq ft pipeline representing c.£7.7 million pa new rent at a 6.9% yield on cost High quality investment portfolio £1.5 billion portfolio (EPRA topped up NIY of 5.4%) Occupancy at 99.3%. WAULT at 12.8 years 49% of contracted rental income subject to uplifts Reversionary potential in distribution assets reflected in post year end rent review settlements at 15.4% above passing rent and 2.7% above ERV Only 6% of income expires within next five years Finances strengthened and capacity increased to deliver developments Net debt of £591.2 million and LTV of 38% (2015: 36%) Debt maturity of 5.6 years (2015: 4.2 years) Average cost of debt at 3.5% (2015: 3.7%) and 93% (2015: 80%) of existing debt hedged Undrawn facilities of £69.9 million
SLIDE 2 LondonMetric Property Plc 2
Andrew Jones, Chief Executive of LondonMetric, commented: “Our focus on growing our income has delivered a substantial increase in EPRA earnings during the year and we will continue to grow our repetitive and predictable income further. As yield tranquillity sets in, the compounding impact of this repetitive effect is becoming increasingly attractive. “Distribution is the best performing retail sub sector driven by rapidly changing consumer shopping patterns and the need for retailers to continually invest in their distribution capabilities to remain
- competitive. Since merger, we have consciously increased our distribution exposure from 20% to
54% of the portfolio by value, and this is set to grow further, capitalising on this trend and building
- n our retailer relationships.
“We continue to experience strong structural demand/supply dynamics in this sub sector and our 2.0 million sq ft distribution development programme will help to deliver sustainable earnings and income growth as well as incremental returns. “Our portfolio metrics are as strong as ever and we remain highly disciplined in our investment approach.” For further information, please contact: LONDONMETRIC PROPERTY PLC: +44 (0)20 7484 9000 Andrew Jones (Chief Executive) Martin McGann (Finance Director) Gareth Price (Investor Relations) FTI CONSULTING: +44 (0)20 3727 1000 Dido Laurimore Tom Gough Clare Glynn Meeting and audio webcast A meeting for investors and analysts will be held at 9.00am today at: FTI Consulting, 200 Aldersgate, Aldersgate Street, London, EC1A 4HD. A conference call dial-in is available for the meeting, as follows: From United Kingdom: +44(0)20 3427 1906 Participant Password: 2288491 A live audio webcast will also be available at
http://webcasting.brrmedia.co.uk/broadcast/573de7665e90cd2e3ae66b54
An on demand recording will be available from the same link after the meeting and will also be available from the Company’s website http://www.londonmetric.com/investors/reports-and- presentations Notes to editors: LondonMetric (ticker: LMP) aims to deliver attractive returns for shareholders through a strategy of increasing income and improving capital values. It invests across the UK in retail led distribution, out
SLIDE 3 LondonMetric Property Plc 3
- f town and convenience retail properties. It employs an occupier-led approach to property with a
focus on strong income, asset management initiatives and short cycle development. Its portfolio is broadly split between distribution and retail with a total of 12 million sq ft under management. LondonMetric works closely with retailers, logistics providers and leisure operators to help meet their evolving real estate requirements. Further information on LondonMetric is available at www.londonmetric.com.
Neither the content of LondonMetric’s website nor any other website accessible by hyperlinks from LondonMetric’s website are incorporated in, or form part of this announcement nor, unless previously published by means of a recognised information service, should any such content be relied upon in reaching a decision as to whether or not to acquire, continue to hold, or dispose of shares in LondonMetric. Forward looking statements: This announcement may contain certain forward-looking statements with respect to LondonMetric’s expectations and plans, strategy, management objectives, future developments and performance, costs, revenues and other trend information. These statements and forecasts involve risk and uncertainty because they relate to events and depend upon circumstances that may occur in the future. There are a number of factors which could cause actual results or developments to differ materially from those expressed or implied by these forward-looking statements and forecasts. Certain statements have been made with reference to forecast price changes, economic conditions and the current regulatory environment. Any forward-looking statements made by or on behalf of LondonMetric speak only as of the date they are made. LondonMetric does not undertake to update forward-looking statements to reflect any changes in LondonMetric’s expectations with regard thereto or any changes in events, conditions or circumstances on which any such statement is based. Nothing in this announcement should be construed as a profit forecast. Past share price performance cannot be relied on as a guide to future performance.
SLIDE 4 LondonMetric Property Plc 4
Chairman’s statement
The further alignment of our portfolio towards distribution and the significant income contribution from our recently completed developments have enabled us to comfortably meet our dividend progression commitment.
During the year, we have taken advantage of a strong property market and sold over £200 million
- f assets, the proceeds of which have been recycled into attractive investments yielding 100 bps
more than our sales. Our developments in particular will generate good income and growth potential and we continue to leverage our skills and relationships to maximise current and future opportunities. The income growth we achieved in the year has not been at the expense of our portfolio metrics which are as strong as ever; WAULT remains at 13 years, occupancy is 99.3% and only 6.0% of rent expires within the next five years. Our activities have enabled us to increase the dividend for the year by 4% whilst also achieving a 1.1x dividend cover. The income growth embedded in the portfolio provides good predictability on future dividend progression which has, in part, prompted us to announce that we will commence payment of dividends on a quarterly basis. Our portfolio is aligned to the winning sectors of retail, principally distribution, where the growth in
- nline shopping and the need for better logistics is driving strong occupational demand and rental
growth. We work tirelessly to enhance our occupier and market relationships which, combined with our strong development and asset management capabilities, are fundamental to LondonMetric’s success. We continue to receive tempting approaches for our assets and have recently made further disposals at attractive prices. With a less certain macro outlook, driven by concerns over economic growth and Brexit, interest rates are unlikely to change in the short term. Whilst this low rate environment cannot persist forever, the defensive characteristics of property, particularly its long and strong income, should remain attractive for the foreseeable future. Having served as a Non Executive Director for almost six years, Charles Cayzer is to retire from the
- Board. I should like to thank him for his very significant contribution. I should also like to welcome
Andrew Livingston as a Non Executive Director and look forward to working with him. The Company will benefit from his extensive retail experience. Patrick Vaughan Chairman 1 June 2016
SLIDE 5 LondonMetric Property Plc 5
Chief Executive Q&A
Andrew Jones (CEO) gives an overview of progress in the year, his assessment of the structural forces affecting the retail sector and the impact on LondonMetric.
Q What is your main focus at LondonMetric? A Our overriding concern is to deliver value to shareholders over the long term. We continue to focus on managing both the structural and cyclical forces that influence our
- business. As managers of risk, we need to fully understand the dynamics of these forces and
navigate the business accordingly. Our judgement is not clouded by the burden of legacy assets and we endeavour to own assets that remain relevant in a rapidly changing retail environment. Equally, we believe that the world is evolving from a focus on active strategies to more passive ones, where the offer of higher repetitive and predictable income is clearer and more attractive. Whilst it is not always the case, investors are valuing quality of income today more highly than its equivalent in NAV potential upside. Q What specific structural forces are affecting LondonMetric? A Recession and technology have significantly altered consumer expectations and habits. Shopping patterns are rapidly evolving and the expectation of efficiency, speed, value and convenience are driving omni-channel retailing. The change in the digital economy is having a profound impact on retail stores and how they have been traditionally understood. Retail is changing to reflect this and the problems at retailers such as BHS are just the tip of the iceberg for a sector bedevilled by high rents, heavy discounting, inadequate online platforms and far too much physical capacity. Retailers have to invest heavily in their distribution capability and continually evolve their infrastructure to drive operational efficiencies. Occupier demand for modern, high specification distribution warehousing has meant that availability is low and this has created structural demand/supply dynamics with good rental growth in evidence for the right assets. This is especially the case for more strategically located depot warehousing and last mile distribution property which facilitate same day and next day delivery requirements, particularly in the South East and major UK conurbations. Q How are you responding to the changing retail environment? A The £392 million of transactions in the year demonstrates our ongoing response to these changes. We have made significant further sales of mature retail assets, achieving attractive prices, whilst recycling into big box logistics and smaller distribution warehouses, which offer attractive risk adjusted yields and asset management opportunities. During the year, we acquired £155 million of distribution assets let to occupiers such as Next, Poundworld and DHL. We successfully delivered 1.9 million sq ft of developments and our distribution developments in Wakefield and Warrington are on track to complete later this year. These two developments along with our pipeline developments at Stoke, Bedford and Crawley will add a further £11.8 million of rental income. Distribution assets, including developments, totalled £824 million at the year end and now represent 54% of our portfolio – a significant increase from 20% at the time of merger in 2013. Our strong retailer relationships have also generated further convenience deals where we have worked in partnership with M&S and Aldi.
SLIDE 6 LondonMetric Property Plc 6
Q What are the key drivers of LondonMetric’s success? A Our strong occupier relationships as well as the deep relationships that we have within the real estate sector are paramount to our success and key to maintaining our very strong portfolio metrics
- f long leases, extremely high occupancy and strengthening income. Our asset management
activities delivered 55 lettings and rent reviews which helped to drive like-for-like income growth of 3.1% at 6.9% above ERV. We remain unemotional about ownership of our assets and have crystallised strong returns from disposals whilst ensuring that we are unencumbered by legacy or less relevant assets. As evidenced by our £80 million of distribution disposals, we will sell core assets where purchasers’ assessment of value is higher than our own aspirations. In today’s competitively priced environment, we are also disciplined and rational. We will step away from opportunities that don’t meet out return criteria and our customer centric model helps us to make the correct real estate decisions. The management team is fully aligned with shareholders and is incentivised to deliver enhanced returns and not simply grow assets under management. Q How have you improved your financing arrangements and describe your approach to gearing and managing interest rate risk? A At the start of the year, we signed a new £400 million unsecured facility which was recently increased to £444 million. This facility provides significantly greater flexibility and has helped to reduce finance fees that might otherwise have arisen from our investment and development
- activity. It has also helped to increase our average debt maturity to 5.6 years, reduce our cost of
debt to 3.5% and provide additional financing headroom. Our loan to value of 38% at the year end is at an appropriate level that allows us to draw down further on our debt facilities to fund developments without impacting on our conservative approach to gearing. We continue to take a prudent approach to managing interest rate risk and, as at the year end, 93% of our drawn debt was hedged. Q How has LondonMetric delivered on its Responsible Business Strategy? A We have built on our significant progress from the previous year and our efforts have been recognised with an EPRA SBPR Gold Award and a substantially improved GRESB score. 94% of our 2015-16 targets were achieved and highlights included the introduction of a new Responsible Business Procurement Policy and implementation of initiatives to install solar panels, replace external lighting and monitor occupier contentment and energy usage. In addition we completed three major developments, all of which are rated BREEAM Very Good. Q What are you most alert to as you look forward? A We continue to monitor investment activity and market liquidity very closely. This ensures that we maintain flexibility to fund our developments and other opportunities as they arise whilst enjoying attractive margins of safety between our long and strong income and our cost of debt. Andrew Jones Chief Executive 1 June 2016
SLIDE 7 LondonMetric Property Plc 7
Driving logistics and retail real estate requirements
Logistics
Online retail is driving demand for a range of different types of warehousing including mega national distribution centres, parcel sortation centres, local parcel depot stations, dot.com warehouses and local delivery centres for same day delivery. The occupier market remains robust with take up above long term averages. Around 4.5 million sq ft was taken up in Q1 2016 which was 22% up on Q4 2015 and 18% up on Q1 2015. Supply remains muted. From a peak availability of 94 million sq ft in 2009, it is estimated that current supply is c.15 million sq ft equating to approximately six months’ demand. Speculative development has risen as a result of the demand supply imbalance however remains significantly below pre-recession levels of c. 10 million sq ft per annum at 5.6 million sq ft per annum. The average void period for units speculatively built since 2009 is just five months, reducing to five weeks in prime locations such as the Midlands.
Retail
Whilst online is contributing to a successful supply/demand dynamic in logistics, it is causing great disruption to more traditional retail real estate. A shop unit is no longer the only route to market and as a result retailers continue to re-examine and rationalise their store networks. According to Local Data Company, vacancy rates across retail shops stand at 12.4%, however this masks the polarisation within this market. Prime retail real estate is more robust with secondary and tertiary retail increasingly redundant in today’s digital age. Rental levels continue to fall in poorer retail locations as shoppers vote with their feet and retailers see no need to be located there. The success stories within retail real estate revolve around top up, convenience-led retail. Footfall supports the strength of retail parks nationally, with their convenience and the ease at which click and collect orders can be fulfilled. Destination retail remains strong however the consumer expects more which is resulting in increased capital expenditure and operational costs to keep the destination relevant and attract footfall.
Leading to a re-rating in asset pricing
Investor demand remains strong for distribution assets. Investment volumes in this sector in the last two years have been the strongest for the last 15 years. Yields have continued to narrow further with prime distribution yields being c.4.5% having improved by 125 bps in the last two years. Further yield compression is likely to be muted, however rental values are growing reflecting the supply/ demand imbalances in the sector. Investment volumes in the retail sector are down on historic long term averages, possibly reflecting a perceived nervousness in the sector and the future role the sector has to play in the market. Yields remain robust for prime retail with weakness seen in the secondary markets reflecting the
Outlook
We believe that the pace of change will continue. The significant evolvement since 2009 demonstrates the impact that technological changes and shopping behaviour is having on real estate requirements. Non-food online spending is estimated to grow from 17.4% today to 25% of all non food sales by the end of 2019. It is now widely accepted by retailers that the supply chain is consumer facing requiring retailers to have fit for purpose logistics to meet the increasing consumer demands for instant gratification and quicker online delivery. We believe that the retailers’ response and impact to real estate requirements means that sheds are the new shops. We seek to position our real estate portfolio to these wider structural trends whilst maximising shareholder returns through the cyclical drivers of the market.
SLIDE 8 LondonMetric Property Plc 8
Investment review
Our strategy is to own desirable real estate that offers opportunity to leverage our asset management and development capabilities. Delivering future income and capital growth
Our disciplined approach to capital allocation prompted us to sell £204 million of assets which had delivered on their business plans. In particular, as yields continued to tighten across the property market, we have taken the opportunity to sell a significant number of retail assets at highly attractive prices. We also made selective distribution disposals and continue the sell down of our remaining residential assets. Through our strong market relationships, we selectively recycled into earnings accretive acquisitions that offered good income growth prospects, delivering a 100 bps positive yield arbitrage.
Significant retail disposals
Our main focus was on the further disposal of our retail parks and we sold £110 million of retail assets at a net initial yield of 5.8%, 160 bps better than their historic yield on cost. These disposals crystallised impressive returns and generated an average geared IRR of 26%, reflecting both the benefit from market yield compression and our asset management activity. Post year end, we sold a further three retail parks and one cinema for £17 million.
Selective distribution disposals
Distribution disposals totalled £80 million across four assets. These four disposals resulted from direct approaches where the prices offered were ahead of our value aspirations. We had regeared several of these assets and as a result of our actions and market yield compression generated an impressive geared IRR of 36%. At our recently completed development in Warrington, let to The Hut Group, the occupier has exercised its option to purchase the asset for £54 million reflecting a NIY of 6.5%. The yield on cost was 8.0% and the sale completes in November 2016, generating a geared IRR of 22%.
Acquisition activity focused on distribution
In a highly competitive investment market we remained disciplined and selective in acquiring assets. During the year, we purchased 16 assets totalling £188 million, predominantly in the distribution sector, at a blended yield of 6.6%. The forward funded development that we acquired in Wakefield and our recently acquired speculative development in Warrington represented approximately half of the distribution
- investments. These developments are expected to generate a yield on cost of c.100-150 bps higher
than the “up and built” investment yield. We continue to see good development opportunities. The balance of our distribution investments was mainly focused on regional and depot warehouses that have the capability to facilitate next day delivery to major cities and conurbations. We made six such acquisitions in the year, the most significant of which was our £29 million DHL logistics hub in
- Reading. Depot warehouses are typically well located, offer attractive yields and offer strong rental
growth prospects. They are becoming increasingly critical to a retailer’s logistics infrastructure and we anticipate further similar acquisitions going forward.
Value creation from convenience and opportunistic retail assets
Retail acquisitions in the year amounted to £32 million, purchased at a NIY of 7.0%, and these were predominantly convenience food acquisitions that offer modern trading formats, let at affordable rents and on very long leases to occupiers including Aldi and M&S. Towards the year end, we also acquired a development site in Ipswich, pre-let to Wickes.
SLIDE 9 LondonMetric Property Plc 9
Outlook
We remain active and engaged in sourcing new investments and selling out of those retail assets which have delivered to plan. We continue to refresh our development pipeline and make further selective acquisitions and disposals, and expect to further increase the percentage of our portfolio in distribution.
Investment activity by sub sector Acquisitions1 Disposals Cost at share £m NIY % Proceeds at share £m NIY %
Distribution 85.5 6.3 80.4 5.4 Distribution – Development 70.0 6.8 – – Retail 32.1 7.0 110.1 5.8 Residential – – 13.6 1.8 Total 187.6 6.6 204.1 5.6
1 Assuming fully let
Distribution Acquisitions
330,000 sq ft in Doncaster £29.0 million acquisition of a Next warehouse. Purpose built in 2005. Mezzanine floors increase the internal area to 725,000 sq ft. Acquired at a NIY of 6.3% and with a WAULT of nine years. 230,000 sq ft in Reading £28.8 million acquisition of a DHL warehouse in a prime location next to J11 of the M4. Acquired at a NIY of 5.8% and with a WAULT of 10 years. 80,000 sq ft in Royston £8.3 million acquisition of a warehouse let to Hamleys and connected to J10 of the M11. The building was acquired at a NIY of 6.5% and with a WAULT of 13 years. 66,000 sq ft in Castle Donnington £6.0 million acquisition of a warehouse let to Howdens located close to Midlands airport. Acquired at a NIY of 7.1% and with a WAULT of nine years. 64,000 sq ft in Hemel Hempstead £7.5 million acquisition of a warehouse let to Goodrich located one mile from J8 of the M1. Acquired at a NIY of 6.3% and with a WAULT of 15 years. 38,000 sq ft in Basildon £3.5 million acquisition of a warehouse let to Activair. Acquired at a NIY of 6.5% and a WAULT of five years. 25,000 sq ft in Edinburgh £2.4 million acquisition of a warehouse let to Scottish Widows. Acquired at an NIY of 8.2% and a WAULT of 11 years.
SLIDE 10
LondonMetric Property Plc 10
Post period end we acquired a 41,000 sq ft warehouse in Basildon for £3.8 million. The warehouse is let to Modular Heating Group and was acquired at a NIY of 6.5% and a WAULT of four years.
Distribution Developments
524,000 sq ft in Wakefield Purchase and forward fund of a development for £40.0 million pre-let to Poundworld for 15 years and located near J31 of the M62. The anticipated yield on cost is 6.3% and the development is expected to complete in Autumn 2016. 356,000 sq ft in Warrington Purchase and forward fund of a speculative development for £30.0 million located at Omega South logistics hub next to J8 of the M62. The anticipated yield on cost is c.7.0% and the development is expected to complete in November 2016. Post period end we acquired a 112,000 sq ft speculative development site in Crawley at an anticipated cost of £20 million reflecting a 6.3% yield on cost.
Distribution Disposals
341,000 sq ft in Wellingborough Sold for £29.2 million at a NIY of 5.8%. LondonMetric acquired the building for £19.6 million. 268,000 sq ft in Harlow Sold for £37.2 million (Group share: £18.6 million) at a topped up NIY to the purchaser of 5.0%. The building was acquired in 2011 for £22.9 million. 210,000 sq ft in Birmingham Sold for £18.2 million at a NIY of 5.2%. LondonMetric acquired the building for £10.1 million in 2013. 170,000 sq ft in Brackmills Sold for £14.4 million, at a NIY of 5.5%. LondonMetric re-geared the lease at a yield on cost of 8.0%.
Retail Acquisitions
Speke £6.9 million acquisition (Group share: £3.5 million) of a 20,000 sq ft retail unit let for 15 years to Currys PC World at a NIY of 6.8%. Cowes £3.0 million acquisition of a 12,000 sq ft convenience food store let to M&S at a NIY of 5.6%. Penrith £4.7 million acquisition of a 15,000 sq ft convenience food store let to M&S for 20 years at a NIY of 6.0%. Matlock £3.6 million acquisition of a 22,000 sq ft convenience food store at a NIY of 7.0%. 13,000 sq ft has been pre-let to M&S for 25 years. Haslemere £4.7 million acquisition of a 15,000 sq ft convenience food store let to M&S at a NIY of 5.3%. The store opened in March 2016.
Retail Developments
Ipswich £7.9 million acquisition of a 30,000 sq ft development pre-let to Wickes at a yield of 7.8%.
SLIDE 11 LondonMetric Property Plc 11
Leicester £4.7 million acquisition of a 18,000 sq ft development pre-let to Aldi at a yield of 5.7%.
Retail Disposals
Four retail parks were sold for £64.5 million: Milton Keynes £27.2 million disposal of the 77,000 sq ft Westcroft retail park at a NIY of 5.7%, compared to a yield
Southampton £16.2 million disposal of the 52,000 sq ft Mountbatten Retail Park at a NIY of 5.8%, compared to a yield on cost of 6.9%. Hove £13.6 million disposal of the 28,000 sq ft PC World retail unit in Hove at a NIY of 5.4%, compared to a yield on cost of 7.0%. Cannock £7.5 million disposal of the 25,000 sq ft Watling Retail Park anchored by DFS. Sold at a NIY of 6.2%. Our MIPP joint venture has disposed of six assets for £55.2 million (Group share: £27.6 million): Lichfield £13.3 million disposal of the 45,000 sq ft Retail Park at a NIY of 5.5%. Bristol £12.6 million disposal of Longwell Green Retail Park at a NIY of 5.4%. Camborne £9.9 million disposal of our 49,000 sq ft Retail Park at a NIY of 6.1%. Maldon £7.2 million disposal of the 27,000 sq ft Retail Park at a NIY of 6.0%. Haverhill £7.0 million disposal of our 39,000 sq ft Cambridge Road Retail Park at a NIY of 6.1%. Nottingham £5.2 million disposal of the 24,000 sq ft Retail Park at a NIY of 6.4%. One Odeon Multiplex Cinema was sold in Preston for £10.2 million at a NIY of 5.8% and our DFS joint venture sold a property in Enfield for £24.5 million (Group share: £7.5 million) at a NIY of 6.6%. Post period end, there were four further disposals for £25.0 million (Group share: £17.1 million). MIPP sold three assets in Chatham, Bridgwater and Grimsby for £15.9 million (Group share: £8.0m) at a NIY of 5.7%. One Odeon Cinema was sold in Taunton for £9.1 million at a NIY of 5.5%.
Asset management and development review
Our activities have further enhanced our portfolio metrics and strengthened
- ur underlying income and prospects for income growth.
Delivering strong and growing income
Our asset management and development initiatives were fundamental to delivering a significant uplift in our net rental income during the year.
SLIDE 12 LondonMetric Property Plc 12
The £11.7 million per annum of additional income from our successfully completed developments at Islip, Warrington and Kirkstall has been the key driver of this uplift. The blended yield on cost of 7.4% for these developments was materially higher than yields on assets that we have sold. Our occupier transactions in the year also generated £3.5 million of contracted rental uplift. Future income growth underpins further dividend progression. We will continue to recycle into higher yielding opportunities, primarily our 2.3 million sq ft of committed and pipeline developments across 13 assets.
Our activities have maintained the portfolio’s strong income characteristic:
(i) Long income The portfolio weighted average unexpired lease term of 12.8 years (12.2 years to first break) represents one of the longest in the sector. We continue to achieve long leases on asset purchases and occupier transactions of 12.9 years and 13.6 years respectively. Only 6.0% of our income expires in the next five years, rising to only 37.9% over ten years. (ii) Secure income We are highly focused on maintaining a strong and diverse tenant list and ensuring that there is strong occupier contentment. Our occupancy rate is 99.3% and our top ten tenants represent 52.2%
- f total contracted rent compared to 54.1% in 2015. Our top five tenants consist of Primark, Dixons
Carphone, M&S, Argos and Odeon which together account for 32.7% of contracted income. (iii) Rising income Contractual rental uplifts provide security of income growth and 49.0% of our contracted rental income is subject to fixed or RPI linked uplifts. We are confident of capturing meaningful open market rental uplifts from our distribution portfolio given the positive rental growth outlook for the distribution sector.
Value enhancing activities
Valuation uplift in the year was £49.8 million and the portfolio’s topped up net initial yield fell from 5.8% to 5.4%. Our asset management and development activities accounted for 39.3% of yield compression and, going forward, these activities will become increasingly important in delivering valuation uplift. In the year we achieved a property return of 10.9% on our core portfolio and 10.5% for all
- properties. Our core portfolio outperformed the IPD benchmark reweighted for our core sectors of
10.1%.
Asset management – occupier transactions
Area sq ft ‘000
transactions Net uplift in income £m WAULT to expiry years
New lettings and re-gears 253 28 3.3 13.6 Rent reviews 1,836 27 0.2 Total 2,089 55 3.5 During the year, we executed 55 occupier transactions generating a £3.5 million rental income uplift. Lettings were undertaken at a WAULT of 13.6 years. These transactions achieved a 6.9% uplift against ERV and delivered EPRA like-for-like income growth of 3.1%. ERV growth in the year was 6.4%. Our occupancy rate remains very high at 99.3%.
SLIDE 13
LondonMetric Property Plc 13
Lettings
28 lettings were undertaken generating a rental uplift of £3.3 million at an average of £21.40 per sq ft, 13.5% above ERV and with average lease lengths of 13.6 years. King’s Lynn New lettings were signed with B&M, Starbucks, DFS and Tapi Carpets on 43,000 sq ft. The 74,000 sq ft scheme is fully let and will generate £1.5 million per annum of rental income. Coventry Poundworld signed a 10 year lease at the Airport Retail Park. Together with previous lettings to Aldi, B&M and Smyths Toys, the 136,000 sq ft park is fully occupied. Kirkstall The retail park successfully opened in October and is 90% let. We signed lettings with Smyths Toys, Card Factory, Lloyds Pharmacy, Trespass, Iceland, Cancer Research and, post year end, with Peacocks, Holland & Barrett and Specsavers. Leicester Lettings were signed with Home Bargains and Smyths Toys on 28,500 sq ft. Ipswich M&S signed a 15 year lease on 20,000 sq ft and new lettings were signed with Hobbycraft and Brantano. Tonbridge Home Bargains signed a 15 year lease on 15,000 sq ft of space previously occupied by B&Q. Hove Dixons Carphone signed a new 15 year lease on an enlarged 28,000 sq ft unit. Lettings completed post period end and currently in legals total £1.8 million covering 100,000 sq ft.
Rent reviews
During the year we agreed 27 rent reviews, including fixed uplifts, across 1.8 million sq ft at 4.8% above ERV. Post year end, we agreed rental uplifts on two of our distribution assets totalling 0.3 million sq ft at 2.7% above ERV and 15.4% above the previous passing rent.
Occupier contentment
Occupier contentment and working in partnership with our retailers are key priorities for us and we continue to maintain a very high occupancy rate at 99.3%. A comprehensive independent occupier survey was undertaken in the year and our top 35 tenants were invited to participate. LondonMetric achieved very favourable scores from those that responded: 100% scored LondonMetric as either good or excellent in relation to how satisfied they were with LondonMetric as a landlord and how well we understood their needs. 75% scored our ability to offer real estate solutions as good or excellent, with the remainder scoring us in line with expectations. 73% rated LondonMetric as better when compared against other landlords, with the remainder rating us in line with other landlords.
Short-cycle development
We successfully completed three major developments in the year across 1.9m sq ft delivering £11.7m of additional income. Post year end, we completed the development at Ferndown let to M&S.
SLIDE 14 LondonMetric Property Plc 14
In addition to a number of smaller retail developments, we will complete our distribution developments in Wakefield and Warrington by the end of 2016. Committed and pipeline developments total 2.3m sq ft.
Development summary (currently committed and pipeline)
Scheme Sector Area sq ft ‘000 Anticipated additional rent £m Yield
%
Committed Wakefield Distribution 524 2.5 6.3 Warrington Distribution 356 2.2 7.0 Tonbridge Retail 71 0.7 8.0 King’s Lynn Retail 64 1.0 11.3 Liverpool Retail 29 0.5 5.9 St Margaret’s, Leicester Retail 29 0.4 7.4 Aldi, Leicester Retail 18 0.3 5.6 Coventry Retail 18 0.3 7.3 Loughborough Retail 12 0.5 5.1 1,121 8.4 7.1 Conditional Bedford Distribution 700 4.4 7.3 Stoke Distribution 300 1.4 6.0 Crawley Distribution 112 1.3 6.3 Ipswich Retail 31 0.6 8.0 1,143 7.7 6.9
Distribution developments
Wakefield The forward funded development is pre-let to Poundworld for 15 years. Construction completes in September 2016. Warrington Planning was approved in March 2016. Construction has commenced and completion is expected by November 2016. Bedford Planning consent received for a development of up to 700,000 sq ft with acquisition of the land expected in September 2016. Several schemes for the site are under consideration. Stoke Planning consent for up to 300,000 sq ft was received in the year and demolition work has commenced and is expected to complete in January 2017. Crawley Speculative development of 112,000 sq ft. Planning is expected by December with practical completion anticipated in Spring 2018.
Retail developments
King’s Lynn Construction work is expected to complete in October 2016. Tonbridge Downsizing of the 18,000 sq ft Halfords unit will complete in September 2016. Planning consent to split and extend the 38,000 B&Q unit is expected in June 2016.
SLIDE 15
LondonMetric Property Plc 15
Ipswich The former Tesco site has been acquired and revised planning consent is expected by September 2016. Leicester 28,500 sq ft at St Margaret’s Retail Park will be completed and handed over in July 2016. The nearby 18,000 sq ft Aldi development at Abbey Lane is expected to complete in August 2016. Coventry Development of the 18,000 sq ft Aldi store at the Airport Retail Park is expected to complete in October 2016. Loughborough Extension works to the Morrisons store complete in December 2016.
Key responsible development activities in the year
Islip, Northamptonshire 1,062,000 sq ft distribution warehouse let to Primark Completed in September 2015 BREEAM Very Good Built on brownfield site which was once an ironworks Solar panels installed covering 30,000 sq ft and generating electricity for the occupier Roof lights on 100,000 sq ft Foul drainage system on-site with dedicated treatment plant Monitoring energy usage of occupier Warrington 690,000 sq ft distribution warehouse let to The Hut Group Completed in November 2015 BREEAM Very Good Roof lights on 66,000 sq ft Roof designed for future fitting of solar panels Surface water discharge storage incorporated into scheme Kirkstall, Leeds 120,000 sq ft retail park Completed in October 2015 BREEAM Very Good Insulation and solar shading incorporated into scheme High efficiency LEDs for external lighting Tenant fit out guide produced for occupiers Initiating monitoring of occupier energy usage Coventry 136,000 sq ft retail park Responsible asset management and development has transformed the retail park and generated significant socioeconomic benefits Ten occupier initiatives added four new retailers Currently developing an 18,000 sq ft Aldi convenience store which completes in October 2016 Initiating car park lighting upgrade and, in partnership with Dixons Carphone, installed solar panels
Financial review
Our ongoing commitment to reposition the portfolio and capitalise on asset management and development opportunities has enabled us to grow income and earnings this year.
SLIDE 16 LondonMetric Property Plc 16
This year we achieved one of our key strategic and longstanding goals of fully covering our dividend commitment, as the charge for the year, paid in December 2015 and April 2016, was 107% covered by EPRA earnings. We have achieved both earnings and NAV growth this year and have strengthened and de-risked our financing position. EPRA earnings have increased by 18.6% to £48.5 million or 7.8p per share, compared with £40.9 million or 6.6p last year. We entered into a new £400 million unsecured revolving credit facility at the beginning of the year and refinanced £269m of secured debt, lowering the average interest rate, increasing debt maturity and strengthening the balance sheet. EPRA NAV per share is 147.7p, an increase of 5.0% in the year or 6.6% excluding the additional 2p special dividend which was paid in July 2015. Reported profit has fallen to £82.7 million as a result of lower valuation gains and a £16.8 million adverse movement in derivatives. Our strong financial results are underpinned by robust portfolio metrics, the combination of which has enabled us to increase the ordinary dividend for the year to 7.25p, up 3.6% from last year. We have decided to commence the payment of our dividends on a quarterly basis going forward with the next payment of 1.8p expected in October 2016. Our financing ratios remain strong with LTV at 38%, an average cost of debt of 3.5% and loan maturity of 5.6 years. Management monitors the performance of the business on a proportionally consolidated basis, although the statutory results reflect the share of joint ventures using the equity accounting
- method. The commentary in this review is consistent with the proportionally consolidated approach.
EPRA earnings and other performance measures are used as alternatives to IFRS equivalent measures as they highlight the Group’s underlying recurring performance. EPRA earnings is a key performance indicator, reflecting the recurring profit of the Group’s property rental business and excludes items such as changes in property valuations and movements in the fair value of derivatives.
Income statement
EPRA earnings for the Group and its share of joint ventures are detailed as follows:
For the year to 31 March Group £m JV £m 2016 £m Group £m JV £m 2015 £m
Gross rental income 67.9 11.1 79.0 60.2 13.8 74.0 Property costs (0.8) (0.5) (1.3) (2.6) (0.5) (3.1) Net rental income 67.1 10.6 77.7 57.6 13.3 70.9 Management fees 2.2 (0.9) 1.3 2.2 (0.9) 1.3 Administrative costs (13.6) (0.2) (13.8) (12.5) (0.1) (12.6) Net finance costs (13.8) (2.9) (16.7) (15.4) (3.2) (18.6) Other – – – – (0.1) (0.1) EPRA earnings 41.9 6.6 48.5 31.9 9.0 40.9 The table below reconciles the movement in EPRA earnings in the year:
£m p
EPRA earnings 2015 40.9 6.6 Net rental income 6.9 1.1 Administrative costs (1.2) (0.2) Net finance costs 1.9 0.3 EPRA earnings 2016 48.5 7.8
SLIDE 17 LondonMetric Property Plc 17
Net rental income
Net rental income increased 9.6% in the year to £77.7 million. Movements in net rental income are reflected in the table below:
£m
Net rental income 2015 70.9 Like-for-like properties 15.1 Acquisitions 3.4 Disposals (13.5) Property costs 1.8 Net rental income 2016 77.7 There was significant growth in like-for-like rental income in the year which increased by £15.1 million due to the impact of acquisitions in the previous year, contributing additional income of £9.4 million and the completion of three large developments, contributing a further £5.0 million. In addition the Group increased its holding in the MIPP joint venture from 33% to 50% in the previous year resulting in additional income of £0.6 million this year. Income lost as a result of disposals in the year of £13.5 million was offset in part by income of £3.4 million generated by acquisitions in the year. Last year £1.6 million of development feasibility costs were written off and included within reported property costs. After adjusting for these non recurring costs, property costs have fallen by £0.2 million or 13.3% compared with the previous year. This reflects lower vacant unit costs post disposals of Carter Lane and residential assets.
Administrative costs
Administrative costs have increased by 9.5% to £13.8 million after capitalising staff costs of £1.5 million (2015: £1.7 million) in respect of time spent on development activity in the year. Total administrative costs including amounts capitalised increased by 7.0% or £1.0 million to £15.3 million, primarily due to an increased LTIP charge as each of the awards granted in the three years post-merger are now being amortised.
EPRA cost ratio
The Group’s cost base is closely monitored and the EPRA cost ratio is used as a key measure of effective cost management.
2016 % 2015 %
EPRA cost ratio including direct vacancy costs 17 19 EPRA cost ratio excluding direct vacancy costs 17 17 The EPRA cost ratio for the year, including direct vacancy costs, was 17% compared with 19% last
- year. The ratio reflects total operating costs, including the cost of vacancy, as a percentage of gross
rental income. The full calculation is shown in Supplementary note iv.
Net finance costs
Net finance costs, excluding the costs associated with repaying debt and terminating hedging arrangements on sales and refinancing in the year were £16.7 million, a decrease of £1.9 million
This was due to a £1.8 million increase in interest receivable from forward funded development projects and an increase in capitalised interest on developments of £1.1 million, both offset by increased commitment fees on the unsecured facility and bank interest costs associated with higher levels of debt of £1.0 million.
SLIDE 18 LondonMetric Property Plc 18
Our interest rate exposure is hedged by a combination of fixed and forward starting interest rate swaps and caps. At 31 March 2016 93% of our debt was hedged. Independent advice is given by J C Rathbone Associates.
Share of joint ventures
EPRA earnings from joint venture investments were £6.6 million, a reduction of £2.4 million over last year as reflected in the table below.
For the year to 31 March 2016 £m 2015 £m
MIPP 4.0 3.4 Retail Warehouse 2.4 3.2 Distribution – 2.6 Residential 0.2 (0.2) 6.6 9.0 In addition the Group received net management fees of £1.3 million for acting as property advisor, consistent with the previous year. The Group’s distribution joint venture disposed of its remaining asset in Harlow in June 2015 and its residential joint venture sold a further 25 flats at Moore House, London.
IFRS reported profit
A full reconciliation between EPRA earnings and IFRS reported profit is given in note 8(a) to the accounts and is summarised in the table below.
For the year to 31 March Group £m JV £m 2016 £m Group £m JV £m 2015 £m
EPRA earnings 41.9 6.6 48.5 31.9 9.0 40.9 Revaluation of investment property 51.1 (1.3) 49.8 112.4 6.0 118.4 Fair value of derivatives (16.7) (0.1) (16.8) (7.5) (1.1) (8.6) Debt and hedging early close out costs (0.1) (0.4) (0.5) (3.9) (0.1) (4.0) Profit/(loss) on disposal 2.4 (0.3) 2.1 13.4 0.5 13.9 Other items1 (0.4) – (0.4) (1.1) – (1.1) IFRS reported profit 78.2 4.5 82.7 145.2 14.3 159.5
1 Other items include amortisation of intangible assets and deferred tax
Despite an 18.6% increase in the year in EPRA earnings to £48.5 million, the Group’s reported profit for the year was £82.7 million compared with £159.5 million last year. The £76.8 million reduction was primarily due to lower property valuation gains realised and a larger adverse movement in derivatives. Medium and long term interest rates have fluctuated over the year falling to very low levels by year end thereby increasing our exposure to out of the money swaps. Other movements in reported profit include the profit on sale of properties and associated debt and hedging break costs, which together totalled £1.6 million this year compared with £9.9 million last
- year. In the previous year the sale of offices at Carter Lane generated a profit on sale of £12.4
- million. The total profit over original cost on sales in the year was £37.9 million or 23% (2015: £51.1
million or 23%). The amortisation of the MIPP management contract, acquired on merger in 2013, continues to flow through the income statement and is reflected in other items in the table.
SLIDE 19 LondonMetric Property Plc 19
Balance sheet
EPRA net assets for the Group and its share of joint ventures are as follows:
As at 31 March Group £m JV £m 2016 £m Group £m JV £m 2015 £m
Investment property 1,346.2 174.7 1,520.9 1,164.1 236.3 1,400.4 Gross debt (575.0) (62.9) (637.9) (465.5) (97.5) (563.0) Cash 42.6 4.1 46.7 50.6 13.0 63.6 Other net (liabilities)/assets (11.7) 4.1 (7.6) (20.6) (3.2) (23.8) EPRA net assets 802.1 120.0 922.1 728.6 148.6 877.2 EPRA net assets increased in the year by £44.9 million or 5.1% to £922.1 million. On a per share basis, net assets increased by 7.1p, or 5.0%, to 147.7p. The movement in the year is summarised below.
£m p
EPRA net asset value 2015 877.2 140.6 EPRA earnings 48.5 7.8 Property revaluation 49.8 8.0 Ordinary dividend paid (43.7) (7.0) Special dividend paid (12.5) (2.0) Other movements1 2.8 0.3 EPRA net asset value 2016 922.1 147.7
1 Other movements include amortisation of intangible assets, profit on sales and share based awards
The major contributor to EPRA NAV growth in the year was the £49.8 million valuation uplift. Our asset management and development activities accounted for 39.3% of yield compression. The impact of the stamp duty increase to 5% on commercial property in March 2016 reduced the valuation uplift by £10.7 million. EPRA earnings covered the ordinary dividend paid in the year. A special dividend was paid in July 2015 to distribute the realised gain on sale of offices at Carter Lane in the previous year. IFRS reported net assets increased by £28.0 million or 3.2% in the year to £898.2 million. A reconciliation between IFRS and EPRA net assets is detailed in note 8(c) to the financial statements.
Portfolio valuation
The Group’s portfolio including its share of joint venture properties grew to £1,520.9 million over the year, an increase of £120.5 million or 8.6%. The core property portfolio of retail and distribution assets (including associated development) represented 91% of the total portfolio valuation at the year-end compared to 90% in March 2015 as reflected in the following segmental analysis:
As at 31 March 2016 £m 2015 £m
Retail 543.8 567.8 Distribution 784.4 558.6 Offices 80.2 73.3 Residential 55.9 69.6 Development1 56.6 131.1 Property value 1,520.9 1,400.4
1 Distribution £40.0 million; Retail £16.6 million
SLIDE 20 LondonMetric Property Plc 20
Investment in distribution assets, including those under development, has increased to 54% of the portfolio from 47% last year as reflected in Supplementary note ix. We have retained our remaining office at Marlow and have continued to sell down residential assets. Investment in development assets has fallen as three developments at Islip, Kirkstall and Warrington completed on schedule in the year and have been reclassified as investment assets. The movement in the investment portfolio is explained in the table below.
As at 31 March Portfolio value £m
Opening valuation 2015 1,400.4 Acquisitions 113.0 Developments 105.0 Capital expenditure on completed properties 14.5 Disposals (193.2) Revaluation 49.8 Lease incentives 31.4 Closing valuation 2016 1,520.9 Further detail on the split between Group and joint venture movements can be found in Supplementary note vii. The Group’s commitment to its development pipeline is evidenced by the significant spend in the year, which included £71.3 million on forward funded developments at Warrington, Wakefield, Ferndown, Liverpool and Leicester and £33.7 million on other developments, principally at Kirkstall and Islip. Three of these developments completed in the year. The Group has continued to take advantage of the strong investment market to dispose of mature assets that have delivered their business plans and enabled us to recycle capital into big box logistics and smaller distribution units which offer attractive yields, strong rental growth prospects and asset management opportunities. The disposal of 16 commercial and 26 residential assets in the year generated proceeds of £204.1 million at share and reduced the carrying value of property by £193.2 million.
Financing
Net debt on a proportionately consolidated basis at the year end was £591.2 million, a £91.8 million
- r 18.4% increase over last year. The proportionally consolidated key performance indicators used to
monitor the Group’s debt and liquidity position are shown in the table below.
As at 31 March 2016 £m 2015 £m
Gross debt 637.9 563.0 Cash 46.7 63.6 Net debt 591.2 499.4 Loan to value1 38% 36% Cost of debt2 3.5% 3.7% Undrawn facilities 69.9 83.4 Average debt maturity 5.6 years 4.2 years Hedging 93% 80%
1 2016 LTV includes £10.2 million of deferred consideration receivable on sales 2 Cost of debt is based on gross debt and including amortised costs but excluding commitment fees
The Group and joint venture split is shown in Supplementary note iii. The Group refinanced all of its existing secured debt facilities on 1 April 2015 except for its £196.2 million distribution facility with Helaba and its joint venture facilities. A new unsecured facility was agreed with a syndicate of five lending banks for an initial commitment of £400 million and five year
SLIDE 21 LondonMetric Property Plc 21
- term. The commitment was increased in November 2015 by £43.8 million and the term was
extended by one year in March 2016. The refinancing simplified the Group’s debt arrangements and provides greater operational flexibility. The Group’s share of joint venture gross debt has fallen by £34.7 million or 35.5% since last year as a result of flat sales at Moore House, the distribution warehouse sale in Harlow and retail asset sales through the MIPP and Retail Warehouse joint ventures. The MIPP debt facility with Deutsche Pfandbriefbank was reduced by £37.9 million (Group share: £19.0 million) to £87.1 million (Group share: £43.6 million), of which currently £10.0 million (Group share: £5.0 million) remains available to draw. The Retail Warehouse facility with M&G was reduced by £11.5 million (Group share: £3.5 million) following the sale of a DFS unit in Enfield. Debt maturity and the average cost of debt both improved as a result of the Group refinancing at the beginning of the year and were 5.6 years (2015: 4.2 years) and 3.5% (2015: 3.7%) respectively at the year end. Loan to value net of cash resources and deferred consideration on the sale of Odeon Preston which completed post year end was 38% (2015: 36%). At 31 March 2016, 93% of our exposure to interest rate fluctuations was hedged. This reduces to 84% as existing undrawn facilities are fully utilised. During the year we acquired forward starting swaps and swaptions to increase and extend the longer term hedging profile. We monitor interest rate movements and since the year end have bought down £66.3 million of legacy interest rate swaps to reduce our interest cost. This reduces our average debt cost to 3.3%. The Group has complied throughout the year comfortably with the financial covenants contained in its debt funding arrangements.
Taxation
As the Group is a UK REIT, any income and capital gains from our qualifying property rental business are exempt from UK corporation tax. Any UK income that does not qualify as property income within the REIT regulations is subject to UK tax in the normal way. We continue to monitor and comfortably comply with the REIT balance of business tests to ensure
- ur REIT status is maintained.
Managing risk
The strategic priorities for the business continue to be the delivery
- f sustainable, progressive earnings and long term capital growth.
The Directors recognise that risk is inherent in running the business and therefore the associated risks must be understood and managed. Board’s role in the process
The Board is responsible for determining the nature and extent of the principal risks that the Company is willing to take in achieving its objectives. It undertakes a robust assessment of the principal risks facing the business at each meeting and has adopted a risk dashboard to assist this
- process. Its assessment covers a three year period, consistent with its statement on viability.
Material issues are monitored so that key risks can be managed appropriately and new risks identified early on and action taken to remove or reduce their likelihood and any potential negative
- impact. Effective risk management has always been embodied within the culture of the business and
decision making processes. In general the Board’s appetite for risk is low where it prejudices its
- bjectives being achieved.
SLIDE 22 LondonMetric Property Plc 22
Audit Committee’s role in the process
The Board has delegated responsibility for detailed assurance of the risk management process to the Audit Committee. The Audit Committee carries out a detailed review of the risk register and internal controls at least once a year to consider the effectiveness of the risk management and internal control processes and reports its findings to the Board. The risk register was last presented to and considered by the Audit Committee in March 2016.
Management’s role in the process
A key part of the risk management process is the assessment of the impact and likelihood of risks
- ccurring so that appropriate mitigation plans can be developed and implemented. The Executive
Committee is responsible for the identification of risk and the design, implementation and maintenance of the systems of internal controls and is assisted by senior management in this
- process. The Company operates from one office location and has short reporting lines ensuring the
Executive Committee’s close involvement in day-to-day matters and enabling increasing risk to be identified quickly and appropriate responses to be put in place. The risk register rates the significance and probability of each risk identified by management as having either a high, medium or low impact. Greater weighting is applied the higher the significance and probability of a risk. These weightings are then mathematically combined to produce an overall gross risk rating which is colour coded using a traffic light system. Specific risk management safeguards for each risk are identified, detailed and rated as strong, medium or weak with greater weighting applied the stronger the safeguard. The gross risk rating and strength of safeguards against that risk are then combined to produce a resultant overall net risk. Consideration is given to the implementation of further action to reduce risk where it is considered necessary. Finally each risk is allocated an owner and details of how the safeguards are evidenced is noted. The principal risks and uncertainties that affect the Company are those risks identified as having the potential to cause material harm to the business and its ability to execute the strategic objectives or exceed the Board’s risk appetite. The risks identified and reported are broadly the same as those reported at the last year end but have been categorised in a manner consistent with the Board’s risk dashboard which it considers at each meeting. The rationale for perceived increases or decreases in the risks identified are contained within the commentary for each risk category.
Corporate risks
Risk, impact, appetite How it is managed Commentary
1 Strategy
That the Company has an unclear or unrealistic strategy for the current stage of the property cycle and economic climate Impact: Suboptimal returns for
Company may not be able to take advantage
effectively manage threats to its success. It may not be able to ensure that the people, resources and The Board review and update strategy and objectives on a regular basis adapting to changes in economic conditions and opportunities as they arise. The Executive Directors are closely involved in the day to day management of the Company which
- perates from one office location and
has a relatively flat organisational structure making it easier to identify market changes. Management have an entrepreneurial approach and extensive experience in real estate particularly the retail Portfolio repositioning has continued during the year towards big box logistics and smaller distribution warehouses. 54% of the portfolio is in the Company’s core distribution sector including 40% in retailer-led distribution, a strong performing sector with real prospects for rental growth and therefore capital growth due to a supply/demand imbalance. Delivery of three developments over 1.9 million sq ft of space in the year adding rent of £11.7 million per annum.
SLIDE 23 LondonMetric Property Plc 23 Risk, impact, appetite How it is managed Commentary
systems are in place to ensure ongoing success. Appetite: The Board views this as fundamental to the business and its reputation. sector. Research is commissioned into consumer shopping patterns and
- ccupational markets to assist in
strategic decisions. Financial forecasts are updated in light
- f strategic changes and reported to
the Board and Executive Committee
- regularly. The Group has a rolling three
year forecast. Management has a substantial investment in the Company and their interests are aligned with external shareholders. The Company’s staffing plan is focused
- n experience and expertise necessary
to deliver its strategy. Committed and pipeline development
- f 2.3 million sq ft is expected to add a
further £16.1 million of rental income. EPRA like-for-like income growth was 3.1% over 55 lettings and rent reviews. These strong operational metrics supported another strong financial performance with EPRA earnings per share increasing 18% to 7.8p. Executive Directors hold 8.5 million shares between them and comfortably meet the Company’s shareholding guidelines. No significant change from 2015
Risk, impact, appetite How it is managed Commentary
2 Economic and political outlook
Economic and political factors may lead to a downturn or specific sector turbulence Impact: Poorer than expected performance, property values may fall, tenant demand and asset liquidity may reduce. Debt markets may be impacted. Appetite: Market conditions are
Company’s control. Research is commissioned into economic matters and market volatility is monitored. The Company only invests in the UK and has little exposure to the London market. A significant proportion of the Company’s portfolio is in a resilient asset class with a supply/demand imbalance. The Company has a high weighted average unexpired lease term reducing re-letting risk. The Company has a low vacancy rate due to its strict investment and development criteria. It also has a diversified tenant base. Acquisition due diligence considers tenant covenant strength. Developments and asset management initiatives are predominantly Weighted average unexpired lease term of 12.8 years and EPRA vacancy rate of 0.7% are amongst the highest and lowest respectively in the industry. Distribution assets represent 54% of the portfolio. Current logistics supply equates to approximately six months’ demand. 88% of development expenditure in the year related to forward funded and pre-let opportunities. The Board is conscious of the uncertainty which surrounds the
- utcome of the European Referendum
and the risks posed by it. The Board is confident that these risks are mitigated by the makeup of the portfolio with its strong focus on retailer-led distribution and convenience and out of town retail
SLIDE 24 LondonMetric Property Plc 24 Risk, impact, appetite How it is managed Commentary
undertaken on a pre-let basis or geographically where a researched supply/demand imbalance exists. The Company has medium term, flexible funding with headroom in covenant levels and no reliance on sales. and that the strong portfolio and financial returns outlined in this report will provide protection in the form of a sustainable long term income return to investors whatever the outcome of the Referendum. Increased risk from 2015
Risk, impact, appetite How it is managed Commentary
3 Human resources
An inability to attract, motivate and retain high calibre staff Impact: That the Company doesn’t have staff with the right skills and experience to deliver its business plan. Appetite: The Board views it as vitally important that the Company has the appropriate level of leadership, expertise and experience to delivery its objectives and adapt to change. The Company maintains an
- rganisational structure with clear
responsibilities and reporting lines. The remuneration structure for staff is aligned to long term performance targets for the business with long term share based incentive arrangements in place. Senior management shareholdings in the Company are significant. Annual appraisals identify training requirements and assess performance. Specialist agencies are contracted where appropriate if there are perceived short term skills shortfalls. The Chairman’s contract was extended to 31 March 2017. Further consideration will be given to the position of Chairman during the course of the current year. The Company appointed an executive search company, Zygos, to source potential Non Executive Director candidates for succession planning
- purposes. As a result of this search
Andrew Livingston, Chief Executive of Screwfix, will be proposed to replace Charles Cayzer on the Non Executive Board. Additional staff have been employed with development and logistics expertise given increased focus on these areas. No significant change from 2015
Risk, impact, appetite How it is managed Commentary
4 Systems, processes and financial management
SLIDE 25 LondonMetric Property Plc 25 Risk, impact, appetite How it is managed Commentary
Controls for safeguarding assets and supporting strategy are weak Impact: Inadequate asset
returns and decisions made on inaccurate information. Appetite: The Board’s appetite for such risk is low and management continually strives to monitor and improve processes. There is a strong control culture within the Company. Systems security is in place, supported by a specialist advisor. Business continuity plans are up to date with adequate back up which is tested. Procedures are in place to ensure accuracy of the property database and data capture. Assets are safeguarded with appropriate levels of insurance. Appropriate segregation of duties and controls over financial systems are in place. Financial information is provided to management on a timely basis for approval and decision making purposes. Costs are controlled with procedures to ensure that expenditure is valid, properly authorised and monitored A new property database was implemented in the year which interfaces with the accounting system to provide up to date accessible
- information. The external auditors
tested the integrity of the system which has been used to provide the key portfolio metrics in this report. The Audit Committee received and considered a report from management
- n the implementation of the new
system in the context of internal control. No significant change from 2015
Risk, impact, appetite How it is managed Commentary
5 Regulatory and tax framework
Non compliance with legal or regulatory
Impact: Fines, penalties, sanctions and reputational damage which may impact investor demand in the
loss of REIT status. Increased costs. Impact on re-letting potential of an asset. Appetite: The Board has no appetite where non There is a clear focus on obligations under the Company’s responsible business strategy and regulatory influences on the business such as Health & Safety, environmental, employment, anti-corruption related legislation and the UK Corporate Governance Code. Responsibility for specific obligations is allocated to individuals and overseen by the Executive Committee. External specialists provide advice and support. Staff training is provided. The Company is provided with external specialist tax advice. Compliance with REIT legislation is The Company has been affected by recent tax changes. The increase in the commercial rate of SDLT to 5% has impacted the whole real estate sector. The stamp duty increase reduced the portfolio valuation uplift in the second half of the year by £10.7 million. Changes in respect of the taxation of residential property, particularly the rate of SDLT has, in addition to economic factors, led to a slowdown in the London residential market to which the Company still has some exposure through a 40% joint venture interest in Moore House. The joint venture has continued to sell down flats with 25 being sold in the
SLIDE 26 LondonMetric Property Plc 26 Risk, impact, appetite How it is managed Commentary
compliance risks injury
tenants, assets, shareholders and reputation. monitored on an ongoing basis for decision making purposes and reported. The impact of legislative changes is considered in strategic terms. year bringing the total number of flats sold to 58. No significant change from 2015
Risk, impact, appetite How it is managed Commentary
6 Investment risk
Investment
sourced at attractive prices Impact: Ability to implement strategy and deploy capital into value and earnings accretive investments at risk. Appetite: The Board aims to keep this risk to a minimum but it is affected to a large degree by matters
The Board’s focus is on having the right people and funding in place to take advantage of
arise. The extensive experience of management and their strong network
- f connections provide insight into the
property market and opportunities. Management’s relationship with retailers and its ability to forward fund assets is an important factor in generating deal flow given that it is harder to find value in income generating assets due to yield compression in the market. The Company acquired £187.6 million
- f property with a number of
significant off market transactions. The yield arbitrage between acquisitions and disposals was 100 bps evidencing appropriate investment and divestment decisions. Opportunities to acquire assets let on long leases to strong covenants have reduced as yields have compressed. Better value opportunities have been identified with development and asset management potential that offer good income growth prospects. No significant change from 2015
SLIDE 27 LondonMetric Property Plc 27 Risk, impact, appetite How it is managed Commentary
7 Development risk
Excessive capital is allocated to activities which carry development risk. Developments fail to deliver expected returns due to inconsistent timing with the economic cycle, adverse letting conditions, increased costs, planning
Impact: Poorer than expected performance. Appetite: The Board is willing to take some speculative development and planning risk if it represents a relatively small proportion of the total property portfolio and is supported by robust research in respect of demand and a high likelihood of planning approval. The Company only considers short cycle and relatively uncomplicated
- development. Management have
significant experience of more complex development. Exposure to developments and phasing of projects is considered as part of the quarterly financial forecasting process for the Board. The Company’s overall level of exposure to development is low as a percentage of the total portfolio. Standardised appraisals and cost budgets are prepared for developments with regular monitoring
- f expenditure against budget to
highlight potential overruns at an early
- stage. External project managers are
appointed. The procurement process includes tendering and the use of highly regarded firms with track records of delivery to minimise uncertainty over costs. Developments are only undertaken in areas of high occupier demand and significant pre-lets are secured where possible before development work commences to de-risk projects. Where possible development sites are acquired with planning approval in place. Development represents 4% of the portfolio at the year end compared with 9% last year. Delivery of three developments over 1.9 million sq ft of space in the year
Further developments in progress at Wakefield, Ferndown, Liverpool and Leicester are all due to complete on time and budget this year. Committed development at the year end totalled 1.1 million sq ft and was 72.3% pre-let. Short cycle development pipeline of 1.1 million sq ft. No significant change from 2015
Risk, impact, appetite How it is managed Commentary
8 Valuation risk
SLIDE 28 LondonMetric Property Plc 28
Assets may fall in value Impact: Pressure on NAV growth and potentially loan covenants. Appetite: There is no certainty that property values will be
inherent risk in the industry. The property cycle is continually monitored with investment and divestment decisions made strategically in anticipation of changing conditions. Property portfolio performance is regularly reviewed and benchmarked
- n an asset by asset basis.
Focus is on income security. Lettings to high quality tenants within a diversified portfolio of well located assets and a high weighted average unexpired lease term reduces the risk
- f negative movements in a downturn.
Acquisitions which have opportunities to enhance value by undertaking asset management initiatives and playing to the strengths of the asset management team and their connections are favoured as well as assets which are considered to be mis- priced. The valuation uplift in the year was £49.8 million. Asset management and development activities accounted for 39.3% of yield compression. 55 letting and rent review transactions generated an increase in like-for-like income of 3.1%. Delivery of developments on schedule and budget supported the valuation assumptions. Our top 10 tenants contribute 52%
- f contracted rental income.
Valuations across the sector have reduced as a result of the increase in the rate of SDLT charged on commercial property from the date of the March 2016 budget.
Risk, impact, appetite How it is managed Commentary
9 Transaction and tenant risk
Property purchases are inconsistent with
diligence is undertaken. Lettings are made to inappropriate tenants Impact: Pressure on NAV, earnings and potentially loan covenants. Appetite: The Board’s appetite to risks arising out of poor due diligence processes
- n acquisitions, disposals
and lettings is low. Acquisitions are thoroughly evaluated by undertaking a detailed financial, legal and operational appraisal prior to Board approval. Asset management initiatives undergo cost-benefit analysis prior to implementation. External advisors are used to ensure appropriate pricing of lease transactions and to carry out acquisition due diligence. Tenant covenant strength and concentration are assessed for all acquisitions and leasing transactions. An experienced property management team work closely with tenants and consider action for slow payers. The Company has a very low level of tenant default within the industry and high occupancy levels. The EPRA vacancy rate at the year end was 0.7%. There were no trade debtors considered at risk at the year end. The tenant base has been further diversified during the year and the covenant strength of the top 10 tenants has increased. The Board consider that fundamentally the occupational market is currently strong particularly for its core asset class.
SLIDE 29 LondonMetric Property Plc 29
Rent collection is closely monitored and reported to the asset management team to identify potential issues. The Group has a diversified tenant base and limited exposure to individual
- ccupiers in bespoke properties.
No significant change from 2015
Risk, impact, appetite How it is managed Commentary
10 Capital and finance risk
The Company has insufficient funds and credit available to it Impact: Implementation of strategy is at risk. Appetite: The Board has no appetite for imprudently low levels of available headroom in its reserves
It accepts a low degree of market standard inflexibility in return for the availability of credit. The Board has some appetite for interest rate risk, loans are not fully
- hedged. This follows cost
benefit assessment and takes into account that not all loans are fully drawn all the time. Assets which have achieved target returns and strategic asset plans are
- sold. Cash flow forecasts are
monitored closely to ensure sufficient funds are available to take advantage
- f investment opportunities and meet
financial commitments. Relationships with a diversified range
- f banks and alternative lenders are
nurtured and loan facilities regularly
- reviewed. The availability of debt and
the terms on which it is available is considered as part of the strategy and analysis for each acquisition and development. Loan facilities incorporate covenant headroom, appropriate cure provisions and sufficient flexibility to implement asset management initiatives. Headroom is actively monitored and incorporated into forecasts. Non financial covenants are also closely monitored. Gearing levels are carefully considered and stress tested before entering into new arrangements. The Company maintains a modest level of gearing
The impact of disposals on secured loan facilities covering multiple assets is considered as part of the decision making process. Interest rate derivatives are used to fix
- r cap exposure to rising rates.
Hedging recommendations are Disposals of £204.1 million and acquisitions of £187.6 million were made in the year demonstrating our ability to recycle capital. The secured Helaba facility was refinanced in the prior year for a seven year term. The Company took advantage of a continuing improvement in the debt market and entered into a £400 million unsecured revolving credit facility to refinance its remaining balance sheet debt on 1 April 2015 for an initial five year term. This facility together with the Helaba facility provides greater operational flexibility and alignment with the real estate strategy. The facility also diversified the lending partners to the Company and has since been extended by a further year and the credit limit raised to £443.8 million. The facility can be increased by a further £56 million. At 31 March 2016 the Group had £593 million of derivatives in place covering 93% of total available debt including joint venture arrangements. Advantage has been taken of falling swap rates during the year and subsequently to improve the hedging profile following the unsecured loan refinancing. The Company complied with all financial covenants during the year. Increased diversification, scale and
SLIDE 30 LondonMetric Property Plc 30
received from a specialist advisor. The Company has joint ventures with well funded partners particularly for larger transactions. Current joint venture arrangements have no significant foreseeable equity requirements. Joint venture partners are chosen with care to ensure that strategies are not misaligned which may impact asset value and liquidity. reduced interest rate costs under the new unsecured facility and hedging profile insulate the Company from credit risks associated with one off shocks from any single asset. Risk reduced since 2015
Viability statement
In accordance with provision C.2.2 of the 2014 revision of the Code, the Directors have assessed the prospect of the Group over a period longer than the 12 months required by the ‘Going Concern’
- provision. The Board conducted this review taking account of the Group’s long term strategy,
principal risks, current position and future plans and for a period of three years. This period was chosen for the following reasons; The Group’s financial business plan and detailed budgets cover a rolling three year period. The business plan includes budgeted profit and cashflows and also considers dividend cover, loan to value, loan covenants and REIT compliance metrics. These are updated and reviewed at least quarterly against actual performance. It reflects the short-cycle nature of the Group’s developments and asset management initiatives. Three major developments completed this year at Islip, Kirkstall and Warrington. All three developments were completed within one year. The average length of asset management initiatives involving significant reconfiguration of retail parks is under one year. All other committed developments in progress at the end of the year are expected to complete in 2016. Three years is considered to be the optimum balance between long term property investment and the inability to accurately forecast ahead given the cyclical nature of property investment. The business model is stress tested to validate its resistance to principal risks including changes to property valuations and associated asset yield curves, ERV growth, future libor and swap rates, committed capital expenditure and the ability to finance forecast transactions and refinance maturing debt. The sensitivity analysis assessed the limits at which key financial covenants and ratios would be breached or deemed unacceptable. The modelling consists of a base case scenario which only includes deals under offer and also an assumed case which factors in reinvestment. Based on the results of their review, the Directors have a reasonable expectation that the Company will be able to continue in operation and meet its liabilities as they fall due over the three year period of their assessment.
SLIDE 31 LondonMetric Property Plc 31
Directors’ responsibility statement
The Directors are responsible for preparing the Annual Report and the financial statements in accordance with applicable law and regulations.
The responsibility statement has been prepared in connection with the Group’s full Annual Report for the year ended 31 March 2016. Certain parts of the Annual Report are not included in this announcement. Company law requires the Directors to prepare financial statements for each financial year. Under that law the Directors are required to prepare the Group financial statements in accordance with International Financial Reporting Standards (IFRSs) as adopted by the European Union and Article 4
- f the IAS Regulation and have elected to prepare the Parent Company financial statements in
accordance with Financial Reporting Standard 101 (FRS101) ‘Reduced Disclosure Framework’. Under company law the Directors must not approve the accounts unless they are satisfied that they give a true and fair view of the state of affairs of the Company and of the profit or loss of the Company for that period. In preparing the Parent Company financial statements, the Directors are required to: Select suitable accounting policies and then apply them consistently Make judgements and accounting estimates that are reasonable and prudent State whether applicable Financial Reporting Standard 101 (FRS101) ‘Reduced Disclosure Framework’ has been followed, subject to any material departures disclosed and explained in the financial statements; and Prepare the financial statements on the going concern basis unless it is inappropriate to presume that the Company will continue in business In preparing the Group financial statements, International Accounting Standard 1 requires that Directors: Properly select and apply accounting policies Present information, including accounting policies, in a manner that provides relevant, reliable, comparable and understandable information Provide additional disclosures when compliance with the specific requirements in IFRSs are insufficient to enable users to understand the impact of particular transactions, other events and conditions on the entity’s financial position and financial performance; and Make an assessment of the Company’s ability to continue as a going concern The Directors are responsible for keeping adequate accounting records that are sufficient to show and explain the Company’s transactions and disclose with reasonable accuracy at any time the financial position of the Company and to enable them to ensure that the financial statements comply with the Companies Act 2006. They are also responsible for safeguarding the assets of the Company and hence for taking reasonable steps for the prevention and detection of fraud and other irregularities. The Directors are responsible for the maintenance and integrity of the corporate and financial information included on the Company’s website. Legislation in the UK governing the preparation and dissemination of financial statements may differ from legislation in other jurisdictions.
Responsibility statement
We confirm that to the best of our knowledge: The financial statements, prepared in accordance with the relevant financial reporting framework, give a true and fair view of the assets, liabilities, financial position and profit or loss
- f the Company and the undertakings included in the consolidation taken as a whole;
SLIDE 32
LondonMetric Property Plc 32
The Strategic report includes a fair review of the development and performance of the business and the position of the Company and the undertakings included in the consolidation taken as a whole, together with a description of the principal risks and uncertainties that they face; and The Annual Report and financial statements, taken as a whole, are fair, balanced and understandable and provide the information necessary for shareholders to assess the Company’s performance, business model and strategy. By order of the Board Martin McGann Finance Director 1 June 2016 Andrew Jones Chief Executive 1 June 2016
Group income statement
For the year ended 31 March
Note 2016 £000 2015 £000
Gross rental income 3 67,948 60,192 Property operating expenses (830) (2,582) Net rental income 67,118 57,610 Property advisory fee income 2,191 2,211 Net income 69,309 59,821 Administrative costs 4 (13,636) (12,502) Amortisation of intangible asset (315) (347) Total administrative costs (13,951) (12,849) Profit on revaluation of investment properties 9 51,063 112,393 Profit on sale of investment properties 2,359 13,395 Share of profits of joint ventures 10 4,528 14,303 Operating profit 113,308 187,063 Finance income 2,182 356 Finance costs 5 (32,748) (27,104) Profit before tax 82,742 160,315 Taxation 6 (18) (864) Profit for the year and total comprehensive income 82,724 159,451 Earnings per share Basic and diluted 8 13.3p 25.5p EPRA 8 7.8p 6.6p All amounts relate to continuing activities.
SLIDE 33
LondonMetric Property Plc 33
Group balance sheet
As at 31 March
Note 2016 £000 2015 £000
Non current assets Investment properties 9 1,346,110 1,164,140 Investment in equity accounted joint ventures 10 119,666 148,366 Intangible assets 182 497 Other tangible assets 392 435 1,466,350 1,313,438 Current assets Trade and other receivables 11 16,049 7,241 Cash and cash equivalents 12 42,621 50,568 58,670 57,809 Total assets 1,525,020 1,371,247 Current liabilities Trade and other payables 13 35,343 31,971 35,343 31,971 Non current liabilities Borrowings 14 567,910 462,255 Derivative financial instruments 14 23,570 6,870 591,480 469,125 Total liabilities 626,823 501,096 Net assets 898,197 870,151 Equity Called up share capital 16 62,804 62,804 Capital redemption reserve 9,636 9,636 Other reserve 222,936 223,061 Retained earnings 602,821 574,650 Equity shareholders’ funds 898,197 870,151 Net asset value per share 8 143.9p 139.4p EPRA net asset value per share 8 147.7p 140.6p The financial statements were approved and authorised for issue by the Board of Directors on 1 June 2016 and were signed on its behalf by: Martin McGann Finance Director Registered in England, No 7124797
SLIDE 34
LondonMetric Property Plc 34
Group statement of changes in equity
For the year ended 31 March
Note Share capital £000 Capital redemption reserve £000 Other reserve £000 Retained earnings £000 Total £000
At 1 April 2015 62,804 9,636 223,061 574,650 870,151 Profit for the year and total comprehensive income – – – 82,724 82,724 Purchase of shares held in trust – – (419) – (419) Vesting of shares held in trust – – 294 12 306 Share-based awards – – – 1,606 1,606 Dividends paid 7 – – – (56,171) (56,171) At 31 March 2016 62,804 9,636 222,936 602,821 898,197
Note Share capital £000 Capital redemption reserve £000 Other reserve £000 Retained earnings £000 Total £000
At 1 April 2014 62,804 9,636 225,420 457,994 755,854 Profit for the year and total comprehensive income – – – 159,451 159,451 Purchase of shares held in trust – – (2,359) – (2,359) Share-based awards – – – 954 954 Dividends paid 7 – – – (43,749) (43,749) At 31 March 2015 62,804 9,636 223,061 574,650 870,151
SLIDE 35 LondonMetric Property Plc 35
Group cash flow statement
For the year ended 31 March
2016 £000 2015 £000
Cash flows from operating activities Profit before tax 82,742 160,315 Adjustments for non cash items: Profit on revaluation of investment properties (51,063) (112,393) Profit on sale of investment properties (2,359) (13,395) Share of post-tax profit of joint ventures (4,528) (14,303) Movement in lease incentives (5,173) (11,600) Share-based payment 1,606 954 Amortisation of intangible asset 315 347 Net finance costs 30,566 26,748 Cash flows from operations before changes in working capital 52,106 36,673 Change in trade and other receivables 2,360 419 Change in trade and other payables (165) 6,439 Cash flows from operations 54,301 43,531 Interest received 50 356 Interest paid (16,516) (13,763) Tax (paid)/received (8) 215 Financial arrangement fees and break costs (6,960) (5,533) Cash flows from operating activities 30,867 24,806 Investing activities Purchase of investment properties (179,000) (279,740) Purchase of other tangible assets (60) (25) Capital expenditure on investment properties (43,584) (32,102) Lease incentives paid (26,006) – Sale of investment properties 123,353 248,356 Investments in joint ventures (10) (12,476) Distributions from joint ventures 33,238 19,524 Cash flow from investing activities (92,069) (56,463) Financing activities Dividends paid (56,171) (43,749) Purchase of shares held in trust (419) (2,359) Vesting of shares held in trust 306 – New borrowings 478,275 166,379 Repayment of loan facilities (368,736) (116,403) Cash flows from financing activities 53,255 3,868 Net decrease in cash and cash equivalents (7,947) (27,789) Opening cash and cash equivalents 50,568 78,357 Closing cash and cash equivalents 42,621 50,568
Notes forming part of the Group financial statements
For the year ended 31 March 2016
1 Significant accounting policies
The financial information set out herein does not constitute the Company's statutory accounts for the years ended 31 March 2016 or 2015, but is derived from those accounts. Statutory accounts for the years ended 31 March 2016 and 31 March 2015 have been reported on by the independent
- auditor. The independent auditor’s reports on the Annual Reports and financial statements for 2016
SLIDE 36 LondonMetric Property Plc 36
and 2015 were unqualified, did not draw attention to any matters by way of emphasis and did not contain a statement under 498(2) or 498(3) of the Companies Act 2006. Statutory accounts for the year ended 31 March 2015 have been filed with the Registrar of
- Companies. The statutory accounts for the year ended 31 March 2016 will be delivered to the
Registrar following the Company's Annual General Meeting. The financial information set out in this results announcement has been prepared using the recognition and measurement principles of International Accounting Standards, International Financial Reporting Standards and Interpretations adopted for use in the European Union (collectively Adopted IFRSs). The accounting policies adopted in this results annoucement have been consistently applied to all the years presented and are consistent with the policies used in the preparation of the statutory accounts for the year ended 31 March 2015. a) General information LondonMetric Property Plc is a company incorporated in the United Kingdom under the Companies Act. b) Statement of compliance The consolidated financial statements have been prepared in accordance with International Financial Reporting Standards (“IFRS”) as adopted by the European Union. c) Basis of preparation The financial statements are prepared on a going concern basis. The functional and presentational currency of the Group is sterling. The financial statements are prepared on the historical cost basis except that investment and development properties and derivative financial instruments are stated at fair value. The accounting policies have been applied consistently in all material respects. i) Significant judgements and key estimates The preparation of financial statements in conformity with IFRS requires management to make judgements, estimates and assumptions that affect the application of accounting policies and the reported amounts of assets, liabilities, income and expenses. The estimates and associated assumptions are based on historical experience and other factors that are considered to be relevant. Actual results may differ from these estimates. Revisions to accounting estimates are recognised in the period in which the estimate is revised if the revision affects only that period. If the revision affects both current and future periods, the change is recognised over those periods. The accounting policies subject to significant judgements and estimates are as follows: Property valuations The valuation of the property portfolio is a critical part of the Group’s performance. The Group carries the property portfolio at fair value in the balance sheet and engages professionally qualified external valuers to undertake six-monthly valuations. The determination of the fair value of each property requires, to the extent applicable, the use of estimates and assumptions in relation to factors such as future lease income, lease incentives, current market rental yields, future development costs and the appropriate discount rate. In addition, to the extent possible, the valuers make reference to market evidence of transaction prices for similar properties. The fair value of a development property is determined by using the ‘residual method’, which deducts all costs necessary to complete the development, together with an allowance for development risk, profit and purchasers’ costs, from the fair valuation of the completed property.
SLIDE 37 LondonMetric Property Plc 37
Significant transactions Some property transactions are complex and require management to assess whether the acquisition
- f property through a corporate vehicle represents an asset acquisition or a business combination
under IFRS3. Where there are significant other assets and liabilities acquired in addition to property, the transaction is accounted for as a business combination. Where there are not it is accounted for as an asset purchase. Other complexities include conditionality inherent in transactions and deferred property completions. Revenue recognition Certain transactions require management to make judgements as to whether, and to what extent, revenue should be recognised and the appropriate cut off for property transactions. Management consider whether the significant risks and rewards of ownership of assets have been transferred between buyer and seller and the point at which developments reach practical completion. Other complexities include the accounting for rent free periods and capital incentive payments. REIT status The Group must comply with the UK REIT regulation to benefit from the favourable tax regime. ii) Adoption of new and revised standards Standards and interpretations effective in the current period During the year the following new and revised Standards and Interpretations have been adopted and have not had a material impact on the amounts reported in these financial statements:
Name Description
Annual Improvements to IFRSs: 2010 – 2012 Amendments to: IFRS 2 Share-based Payments, IFRS 3 Business Combinations, IFRS 8 Operating Segments, IFRS 13 Fair Value Measurement, IAS 16 Property, Plant and Equipment, IAS 24 Related Party Disclosures and IAS 38 Intangible Assets Annual Improvements to IFRSs: 2011 – 2013 Amendments to: IFRS 1 First Time Adoption of International Financial Reporting Standards, IFRS 3 Business Combinations, IFRS 13 Fair Value Measurement and IAS 40 Investment Property Standards and interpretations in issue not yet adopted The IASB and the International Financial Reporting Interpretations Committee have issued the following standards and interpretations that are mandatory for later accounting periods and which have not been adopted early.
Name Description
IFRS 9 Financial Instruments IFRS 15 Revenue from Contracts with Customers IFRS 16 Leases IFRS 11 (amendments) Accounting for Acquisitions of Interests in Joint Operations IAS 1 (amendments) Disclosure Initiative IAS 7 (amendments) Disclosure Initiative IAS 12 (amendments) Recognition of Deferred Tax Assets for Unrealised Losses IAS 16 and IAS 38 (amendments) Clarification of Acceptable Methods of Depreciation and Amortisation IAS 27 (amendments) Equity Method in Separate Financial Statements IFRS 10 and IFRS 12 (amendments) Application of the Consolidation Exception IFRS 10 and IAS 28 (amendments) Sale or Contribution of Assets between an Investor and its Associate or Joint Venture Annual Improvements to IFRSs: 2012 – Amendments to: IFRS 5 Non-Current Assets Held for Sale
SLIDE 38
LondonMetric Property Plc 38
2014 cycle and Discontinued Operations, IFRS 7 Financial Instruments – Disclosures, IAS 19 Employee Benefits and IAS 34 Interim Financial Reporting The Directors do not expect that the adoption of the Standards listed above will have a material impact on the financial statements of the Group in future periods, except that IFRS 9 will impact both the measurement and disclosures of financial instruments, IFRS 15 may have an impact on revenue recognition and related disclosures, and IFRS 16 will impact the accounting for those leases currently classified as operating leases. Beyond the information above, it is not practicable to provide a reasonable estimate of the effect of IFRS 9, IFRS 15 and IFRS 16 until a detailed review has been completed. d) Basis of consolidation i) Subsidiaries The consolidated financial statements include the accounts of the Company and its subsidiaries. Subsidiaries are those entities controlled by the Group. Control is assumed when the Group: has the power over the investee; is exposed, or has rights, to variable return from its involvement with the investee; and has the ability to use its power to affect its returns. In the consolidated balance sheet, the acquiree’s identifiable assets, liabilities and contingent liabilities are initially recognised at their fair value at the acquisition date. The results of subsidiaries are included in the consolidated financial statements from the date that control commences until the date that control ceases. Where properties are acquired through corporate acquisitions and there are no significant assets or liabilities other than property, the acquisition is treated as an asset acquisition, in other cases the purchase method is used. ii) Joint ventures and associates Joint ventures are those entities over whose activities the Group has joint control. Associates are those entities over whose activities the Group is in a position to exercise significant influence but does not have the power to jointly control. Joint ventures and associates are accounted for under the equity method, whereby the consolidated balance sheet incorporates the Group’s share of the net assets of its joint ventures and associates. The consolidated income statement incorporates the Group’s share of joint venture and associate profits after tax. The Group’s joint ventures and associates adopt the accounting policies of the Group for inclusion in the Group financial statements. e) Property portfolio i) Investment properties Investment properties are properties owned or leased by the Group which are held for long-term rental income and for capital appreciation. Investment property includes property that is being constructed, developed or redeveloped for future use as an investment property. Investment property is initially recognised at cost, including related transaction costs. It is subsequently carried at each published balance sheet date at fair value on an open market basis as determined by professionally qualified independent external valuers. Changes in fair value are included in the income statement. Where a property held for investment is appropriated to development property, it is transferred at fair value. A property ceases to be treated as a development property on practical completion. In accordance with IAS 40 Investment Properties, no depreciation is provided in respect of investment properties. Investment property is recognised as an asset when:
SLIDE 39 LondonMetric Property Plc 39
It is probable that the future economic benefits that are associated with the investment property will flow to the Group There are no material conditions precedent which could prevent completion The cost of the investment property can be measured reliably All costs directly associated with the purchase and construction of a development property are
- capitalised. Capital expenditure that is directly attributable to the redevelopment or refurbishment
- f investment property, up to the point of it being completed for its intended use, is included in the
carrying value of the property. ii) Assets held for sale An asset is classified as held for sale if its carrying amount is expected to be recovered through a sale transaction rather than through continuing use. This condition is regarded as met only when the sale is highly probable, the asset is available for sale in its present condition and management expect the sale to complete within one year from the balance sheet date. iii) Tenant leases Management has exercised judgement in considering the potential transfer of the risks and rewards
- f ownership in accordance with IAS 17 for all properties leased to tenants and has determined that
such leases are operating leases. iv) Net rental income Rental income from investment property leased out under an operating lease is recognised in the profit or loss on a straight-line basis over the lease term. Contingent rents, such as turnover rents, rent reviews and indexation, are recorded as income in the periods in which they are earned. Rent reviews are recognised when such reviews have been agreed with tenants. Where a rent-free period is included in a lease, the rental income foregone is allocated evenly over the period from the date of lease commencement to the earlier of the first break option or the lease termination date. Lease incentives and costs associated with entering into tenant leases are amortised over the period from the date of lease commencement to the earlier of the first break
- ption or the lease termination date.
Property operating expenses are expensed as incurred and any property operating expenditure not recovered from tenants through service charges is charged to profit or loss. v) Surplus on sale of investment properties Surpluses on sales of investment properties are calculated by reference to the carrying value at the previous year-end valuation date, adjusted for subsequent capital expenditure. f) Financial assets and financial liabilities Financial assets and financial liabilities are recognised in the balance sheet when the Group becomes a party to the contractual terms of the instrument. Unless otherwise indicated, the carrying amounts
- f the financial assets and liabilities are a reasonable approximation of the fair values.
i) Trade and other receivables and payables Trade and other receivables and payables are initially measured at fair value and subsequently at fair value using the effective interest method. An impairment provision is created where there is
- bjective evidence to suggest that the Group will not be able to collect receivables in full.
ii) Cash and cash equivalents Cash and cash equivalents include cash in hand, deposits held at call with banks and other short- term highly liquid investments with original maturities. iii) Borrowings Borrowings are recognised initially at fair value less attributable transaction costs. Subsequently, borrowings are stated at amortised cost with any difference being recognised in the income statement over the term of the borrowing.
SLIDE 40 LondonMetric Property Plc 40
iv) Derivative financial instruments The Group uses derivative financial instruments to hedge its exposure to interest rate risks. Derivative financial instruments are recognised initially at fair value, which equates to cost and subsequently remeasured at fair value, with changes in fair value being included in the income statement. g) Finance costs and income Net finance costs include interest payable on borrowings, net of interest capitalised and finance costs amortised. Interest is capitalised if it is directly attributable to the acquisition, construction or redevelopment of development properties from the start of the development work until practical completion of the
- property. Capitalised interest is calculated with reference to the actual interest rate payable on
specific borrowings for the purposes of development or, for that part of the borrowings financed out
- f general funds, with reference to the Group’s weighted average cost of borrowings.
Finance income includes interest receivable on funds invested and notional interest receivable on forward funded developments at the contractual rate. h) Tax Tax is included in profit or loss except to the extent that it relates to items recognised directly in equity, in which case the related tax is recognised in equity. Current tax is the expected tax payable on the taxable income for the year, using tax rates enacted
- r substantively enacted at the balance sheet date, together with any adjustment in respect of
previous years. Deferred tax is provided using the balance sheet liability method, providing for temporary differences between the carrying amounts of assets and liabilities for financial reporting purposes and their tax bases. The amount of deferred tax provided is based on the expected manner or realisation or settlement of the carrying amount of assets and liabilities, using tax rates enacted or substantively enacted at the balance sheet date. A deferred tax asset is recognised only to the extent that it is probable that future taxable profits will be available against which the asset can be utilised. i) Share-based payments The fair value of equity-settled share-based payments to employees is determined at the date of grant and is expensed on a straight-line basis over the vesting period based on the Group’s estimate
- f shares that will eventually vest.
j) Shares held in Trust The cost of the Company’s shares held by the Employee Benefit Trust is deducted from equity in the Group balance sheet. Any shares held by the Trust are not included in the calculation of earnings or net assets per share. k) Dividends Dividends on equity shares are recognised when they become legally payable. In the case of interim dividends, this is when paid. In the case of final dividends, this is when approved by the shareholders at the Annual General Meeting.
SLIDE 41 LondonMetric Property Plc 41
2 Segmental information
As at 31 March 2016 2015 Property value 100%
£000 Share
£000 Total £000 100%
£000 Share
£000 Total £000
Retail 429,475 114,323 543,798 422,405 145,406 567,811 Distribution 778,340 6,068 784,408 534,220 24,386 558,606 Offices 80,200 – 80,200 73,300 – 73,300 Residential 1,545 54,350 55,895 3,120 66,453 69,573 Development 56,550 – 56,550 131,095 – 131,095 1,346,110 174,741 1,520,851 1,164,140 236,245 1,400,385
For the year to 31 March 2016 2015 Gross rental income 100%
£000 Share
£000 Total £000 100%
£000 Share
£000 Total £000
Retail 26,066 9,112 35,178 28,340 8,714 37,054 Distribution 37,252 583 37,835 24,443 3,515 27,958 Offices 4,471 – 4,471 7,045 – 7,045 Residential 79 1,389 1,468 4 1,615 1,619 Development 80 – 80 360 – 360 67,948 11,084 79,032 60,192 13,844 74,036
For the year to 31 March 2016 2015 Net rental income 100%
£000 Share
£000 Total £000 100%
£000 Share
£000 Total £000
Retail 25,416 9,053 34,469 26,701 8,711 35,412 Distribution 37,115 573 37,688 24,379 3,559 27,938 Offices 4,434 – 4,434 6,285 – 6,285 Residential 71 943 1,014 (76) 1,067 991 Development 82 – 82 321 – 321 67,118 10,569 77,687 57,610 13,337 70,947 An operating segment is a distinguishable component of the Group that engages in business activities, earns revenue and incurs expenses, whose results are reviewed by the Group’s chief
- perating decision makers and for which discrete financial information is available. Gross rental
income represents the Group’s revenues from its tenants and net rental income is the principal profit measure used to determine the performance of each sector. Total assets are not monitored by segment. However, property assets are reviewed on an ongoing basis. The Group operates almost entirely in the UK and no geographical split is provided in information reported to the Board.
3 Net income
For the year to 31 March 2016 £000 2015 £000
Gross rental income 67,948 60,192 Property operating expenses (830) (2,582) 67,118 57,610 For the year to 31 March 2016, 22% of the Group’s gross rental income was receivable from two
- tenants. For the comparative period no single tenant contributed more than 10% of the Group’s
gross rental income.
4 Administration expenses
a) Total administration expenses
For the year to 31 March 2016 £000 2015 £000
SLIDE 42 LondonMetric Property Plc 42
Staff costs 9,852 8,807 Auditor’s remuneration 183 190 Depreciation 103 88 Other administrative expenses 3,498 3,417 13,636 12,502 b) Staff costs
For the year to 31 March 2016 £000 2015 £000
Employee costs, including those of Directors, comprise the following: Wages and salaries 8,567 8,122 Less staff costs capitalised (1,488) (1,662) 7,079 6,460 Social security costs 724 981 Pension costs 443 412 Share-based payment 1,606 954 9,852 8,807 The long-term share incentive scheme that was created following the merger in 2013 allows Executive Directors and eligible employees to receive an award of shares, held in trust, dependent
- n performance conditions based on the earnings per share and total shareholder return of the
Group over a three-year vesting period. The Group expenses the estimated number of shares likely to vest over the three-year period based on the market price at the date of grant. In the current year the charge was £1.6 million (2015: £1.0 million). The Company awarded 1,839,181 LTIP shares during the year, 1,373,558 of which were awarded to Executive Directors. The cost of acquiring the shares expected to vest of £0.4 million has been charged to reserves. Employee costs of £1.5 million (2015: £1.7 million) have been capitalised in respect of time spent on development projects. c) Staff numbers The average number of employees including Executive Directors during the year was:
2016 Number 2015 Number
Head office and property management 35 36 d) Auditor’s remuneration
For the year to 31 March 2016 £000 2015 £000
Audit services: Audit of the Group and Company financial statements, pursuant to legislation 74 62 Audit of subsidiary financial statements, pursuant to legislation 79 95 Audit related assurance services 26 26 Other fees: Other advisory services – 2 Total fees for audit and other services 179 185 In addition to the above audit fees totalling £31,000 (2015: £37,000) were due to the Group’s auditor in respect of its joint venture operations (excluding LMP Retail Warehouse JV Property Unit Trust).
SLIDE 43
LondonMetric Property Plc 43
5 Finance costs
For the year to 31 March 2016 £000 2015 £000
Interest payable on bank loans and related derivatives 15,641 15,410 Debt and hedging early close out costs 77 3,891 Amortisation of loan issue costs 1,404 1,428 Commitment fees and other finance costs 1,595 509 Total borrowing costs 18,717 21,238 Less amounts capitalised on the development of properties (2,669) (1,607) Net borrowing costs 16,048 19,631 Fair value loss on derivative financial instruments 16,700 7,473 Total finance costs 32,748 27,104 As a result of the refinancing of the Group’s bank facilities in April 2015, £3.1 million of unamortised arrangement costs associated with facilities repaid were written off to the income statement in the previous year.
6 Taxation
For the year to 31 March 2016 £000 2015 £000
The tax charge comprises: Current tax UK tax charge on profit 18 35 Deferred tax Change in deferred tax – 829 18 864 The tax assessed for the year varies from the standard rate of corporation tax in the UK. The differences are explained below:
For the year to 31 March 2016 £000 2015 £000
Profit before tax 82,742 160,315 Tax at the standard rate of corporation tax in the UK of 20% (2015: 21%) 16,548 33,666 Effects of: Expenses not deductible for tax purposes 63 74 Tax effect of income not subject to tax (15,687) (30,701) Share of post-tax profit of joint ventures (906) (3,004) Temporary differences – 829 UK tax charge on profit 18 864 As the Group is a UK-REIT there is no provision for deferred tax arising on the revaluation of properties or other temporary differences.
7 Dividends
For the year to 31 March 2016 £000 2015 £000
Ordinary dividends paid 2014 Final dividend: 3.5p per share – 21,903
SLIDE 44 LondonMetric Property Plc 44
2015 Interim dividend: 3.5p per share – 21,846 2015 Final dividend: 3.5p per share 21,843 – 2015 Special dividend: 2.0p per share 12,482 – 2016 Interim dividend: 3.5p per share 21,846 – 56,171 43,749 Dividend paid in 2017 2016 Second interim dividend: 3.75p per share 23,404 The second interim dividend was approved by the Board on 1 April 2016 and paid on 5 April 2016 to
- rdinary shareholders on the register at the close of business on 18 March 2016. It has not been
included as a liability. It will be recognised as an appropriation of retained earnings in 2017. No final dividend is proposed.
8 Earnings and net assets per share
Adjusted earnings and net assets per share are calculated in accordance with the Best Practice Recommendations of The European Public Real Estate Association (EPRA). The EPRA earnings measure highlights the underlying recurring performance of the property rental business. The earnings per share calculation uses the weighted average number of ordinary shares during the year and excludes the average number of shares held by the Employee Benefit Trust for the year. The net asset per share calculation uses the number of shares in issue at the year-end and excludes the actual number of shares held by the Employee Benefit Trust at the year-end. a) EPRA Earnings EPRA earnings for the Group and its share of joint ventures are detailed as follows:
For the year to 31 March Group £000 JV £000 2016 £000 Group £000 JV £000 2015 £000
Gross rental income 67,948 11,084 79,032 60,192 13,844 74,036 Property costs (830) (515) (1,345) (2,582) (507) (3,089) Net income 67,118 10,569 77,687 57,610 13,337 70,947 Management fees 2,191 (865) 1,326 2,211 (949) 1,262 Administrative costs (13,636) (172) (13,808) (12,502) (141) (12,643) Net finance costs (13,789) (2,947) (16,736) (15,384) (3,238) (18,622) Other (18) – (18) (35) – (35) EPRA earnings 41,866 6,585 48,451 31,900 9,009 40,909 The reconciliation of EPRA earnings to IFRS reported profit can be summarised as follows:
For the year to 31 March Group £000 JV £000 2016 £000 Group £000 JV £000 2015 £000
EPRA earnings 41,866 6,585 48,451 31,900 9,009 40,909 Revaluation of investment property 51,063 (1,276) 49,787 112,393 5,982 118,375 Fair value of derivatives (16,700) (132) (16,832) (7,473) (1,105) (8,578) Debt and hedging early close
(77) (411) (488) (3,891) (58) (3,949) Profit on disposal 2,359 (238) 2,121 13,395 475 13,870 Amortisation of intangible assets (315) – (315) (347) – (347) Deferred tax – – – (829) – (829) IFRS reported profit 78,196 4,528 82,724 145,148 14,303 159,451 b) Earnings per ordinary share For the year to 31 March
2016 £000 2015 £000
Basic and diluted earnings 82,724 159,451 EPRA adjustments1 (34,273) (118,542)
SLIDE 45 LondonMetric Property Plc 45
EPRA earnings 48,451 40,909
1 Adjustments shown in table reconciling EPRA profit with IFRS reported profit
For the year to 31 March 2016 Number of shares ‘000 2015 Number of shares ‘000
Ordinary share capital 628,044 628,044 Average number of shares held in employee trust (3,885) (3,509) Weighted average number of ordinary shares 624,159 624,535 Basic and diluted earnings per share 13.3p 25.5p EPRA earnings per share 7.8p 6.6p c) Net assets per share
As at 31 March 2016 £000 2015 £000
Equity shareholders’ funds 898,197 870,151 Fair value of derivatives 23,570 6,870 Fair value of joint ventures’ derivatives 338 205 EPRA net asset value 922,105 877,226
As at 31 March 2016 Number of shares ‘000 2015 Number of shares ‘000
Opening ordinary share capital 628,044 628,044 Number of shares held in employee trust (3,945) (3,964) Number of ordinary shares 624,099 624,080 Basic net asset value per share 143.9p 139.4p EPRA net asset value per share 147.7p 140.6p Further EPRA performance measures are reflected in the Supplementary notes.
9 Investment properties
a) Investment property
As at 31 March 2016 2015 Completed £000 Under development £000 Total £000 Completed £000 Under development £000 Total £000
Opening balance 1,033,045 131,095 1,164,140 858,668 171,885 1,030,553 Acquisitions 109,546 70,290 179,836 188,988 19,955 208,943 Other capital expenditure 13,720 34,665 48,385 10,545 21,557 32,102 Disposals (128,493) – (128,493) (219,510) (11,941) (231,451) Property transfers 204,823 (204,823) – 106,310 (106,310) – Revaluation movement 41,991 9,072 51,063 76,398 35,995 112,393 Movement in tenant incentives and rent- free uplifts 14,928 16,251 31,179 11,646 (46) 11,600 1,289,560 56,550 1,346,110 1,033,045 131,095 1,164,140 Investment properties are held at fair value as at 31 March 2016 based on external valuations performed by professionally qualified valuers CBRE Limited (“CBRE”) and Savills Advisory Services Limited (“Savills”). The valuation of property held for sale at 31 March 2016 was £62.8 million (2015: £16.0 million).
SLIDE 46 LondonMetric Property Plc 46
The valuations have been prepared in accordance with the RICS Valuation – Professional Standards 2014 on the basis of fair value. Fair value represents the price that would be received to sell an asset, or paid to transfer a liability, in an orderly transaction between market participants at the measurement date. There has been no change in the valuation technique in the year. The total fees earned by CBRE and Savills from the Company represent less than 5% of their total UK revenues. CBRE and Savills have continuously been the signatory of valuations for the Company since October 2007 and September 2010 respectively. Long-term leasehold values included within investment properties amount to £93.9 million (2015: £107.7 million). All other properties are freehold. Included within the investment property valuation is £52.5 million (2015: £20.8 million) in respect of unamortised lease incentives and rent free periods. The historical cost of all of the Group’s investment properties at 31 March 2016 was £1,127.9 million (2015: £984.7 million). Capital commitments have been entered into amounting to £85.5 million (2015: £82.8 million) which have not been provided for in the financial statements. Internal staff costs of the development team of £1.5 million (2015: £1.7 million) have been capitalised, being directly attributable to the development projects in progress. b) Valuation technique and quantitative information
Asset type Fair value 2016 £000 Valuation technique ERV Net initial yield Reversionary yield Weighted average (£ per sq ft) Range (£ per sq ft) Weighted average % Range % Weighted average % Range %
Retail 429,475 Yield capitalisation 16.02 9.01- 23.89 5.62 4.25- 8.16 5.49 4.12- 8.16 Distribution 778,340 Yield capitalisation 5.61 3.95- 9.17 5.01 4.11- 7.23 5.10 4.21- 6.74 Office 80,200 Yield capitalisation 25.94 25.94 5.59 5.59 6.80 6.80 Residential 1,545 Comparison n/a n/a n/a n/a n/a n/a Development – retail 13,175 Yield capitalisation 17.91 14.50- 27.00 4.70 4.25- 5.10 4.77 4.25- 5.10 Development – distribution 29,300 Yield capitalisation 5.00 5.00 5.02 5.02 5.18 5.18 Development 14,075 Residual Note 1 Note 1 Note 1 Note 1 Note 1 Note 1
1 Capitalised market rental values calculated using estimated rentals and market capitalisation rates derived from prior transactions and for comparable transactions in the market.
All of the Group’s properties are categorised as Level 3 in the fair value hierarchy as defined by IFRS 13 Fair Value Management. There have been no transfers of properties between Levels 1, 2 and 3 during the year ended 31 March 2016. The fair value at 31 March 2016 represents the highest and best use. i) Technique The valuation techniques described below are consistent with IFRS 13 and use significant “unobservable” inputs. There have been no changes in valuation techniques since the prior year. Yield capitalisation – for commercial investment properties, market rental values are capitalised with a market capitalisation rate. The resulting valuations are cross-checked against the net initial yields and the fair market values per square foot derived from recent market transactions. Residual – for certain investment properties under development, the fair value of the property is calculated by estimating the fair value of the completed property using the yield capitalisation technique less estimated costs to completion and a risk premium.
SLIDE 47 LondonMetric Property Plc 47
Comparison – for residential properties the fair value is calculated by using data from recent market transactions. ii) Sensitivity An increase or decrease in ERV will increase or decrease the fair value of the Group’s investment properties. An increase or decrease to the net initial yields and reversionary yields will decrease or increase the fair value of the Group’s investment properties. An increase or decrease in the estimated costs of development will decrease or increase the fair value of the Group’s investment properties under development. There are interrelationships between the unobservable inputs as they are determined by market conditions; an increase in more than one input could magnify or mitigate the impact on the valuation. iii) Process The valuation reports produced by CBRE and Savills are based on: Information provided by the Group, such as current rents, lease terms, capital expenditure and comparable sales information, which is derived from the Group’s financial and property management systems and is subject to the Group’s overall control environment Assumptions applied by the valuers such as ERVs and yields which are based on market
- bservation and their professional judgement
CBRE and Savills meet the Auditors and the Audit Committee semi-annually.
10 Investment in joint ventures
At 31 March 2016 the following principal property interests, being jointly-controlled entities, have been equity accounted for in these financial statements:
Country of Incorporation
Property Sector Group Share
Metric Income Plus Partnership England and Wales Retail 50.0% LMP Retail Warehouse JV PUT Guernsey Retail 30.5% LSP London Residential Investments Guernsey Residential 40.0% The principal activity of all joint venture interests is property investment in the UK in the sectors noted in the table above, which complements the Group’s operations and contributes to the achievement of its strategy. The Metric Income Plus Partnership (“MIPP”) in which the Company has a 50% interest acquired one asset in the year for £6.9 million (Group share: £3.5 million) and disposed of six assets for gross proceeds of £55.2 million (Group share: £27.6 million). Associated bank debt of £25.4 million (Group share: £12.7 million) was repaid following net disposals in the year and £12.5 million (Group share: £6.3 million) of the remaining loan facility has been cancelled. The LSP Green Park Distribution joint venture disposed of its remaining distribution warehouse in Harlow in June 2015 for £37.2 million (Group share: £18.6 million) and the LMP Retail Warehouse JV PUT disposed of one asset in Enfield for £24.5 million (Group share: £7.5 million). The Group also disposed of 25 residential flats for £29.8 million (Group share: £11.9 million) through its 40% interest in LSP London Residential Investments in the year. All proceeds received have been used to repay bank debt. At 31 March 2016, the freehold and leasehold investment properties were externally valued by Royal Institution of Chartered Surveyors (RICS) Registered Valuers of CBRE Limited and Savills Advisory Services Limited. The valuation of property held for sale at 31 March 2016 was £17.4 million (Group share: £8.7 million).
SLIDE 48
LondonMetric Property Plc 48
The movement in the carrying value of joint venture interests in the year is summarised as follows:
As at 31 March 2016 £000 2015 £000
Opening balance 148,366 108,990 Additions at cost 10 44,597 Share of profit in the year 4,528 14,303 Disposals (14,110) – Profit distributions received (19,128) (19,524) 119,666 148,366 The Group’s share of the profit after tax and net assets of its joint ventures is as follows:
Metric Income Plus Partnership £000 LMP Retail Warehouse JV PUT £000 LSP London Residential Investments £000 LSP Green Park Distribution Holdings £000 LSP Green Park Trust £000 Total 2016 £000 Group Share 2016 £000
Summarised income statement 100% 100% 100% 100% 100% 100% Gross rental income 12,359 10,964 3,472 343 – 27,138 11,084 Property costs (117) (2) (1,113) (21) – (1,253) (515) Net rental income 12,242 10,962 2,359 322 – 25,885 10,569 Administration expenses (124) (117) (113) (26) (38) (418) (172) Management fees (939) (425) (550) (93) – (2,007) (865) Revaluation loss (1,534) (960) (540) – – (3,034) (1,276) Finance income 45 4 3 – – 52 14 Finance cost (3,555) (2,935) (1,432) (277) – (8,199) (3,372) Movement in derivatives (338) (188) 105 105 – (316) (132) (Loss)/profit on disposal (514) 1,006 (1,108) (185) 771 (30) (238) Tax – – – (5) – (5) – Profit/(loss) after tax 5,283 7,347 (1,276) (159) 733 11,928 4,528 EPRA adjustments: Revaluation loss 1,534 960 540 – – 3,034 1,276 Movement in derivatives 338 188 (105) (105) – 316 132 Loss/(profit) on disposal 514 (1,006) 1,108 185 (771) 30 238 Debt and hedging early close out costs 364 326 153 138 – 981 411 EPRA earnings 8,033 7,815 420 59 (38) 16,289 6,585 Summarised balance sheet Investment properties 165,335 123,685 135,875 – – 424,895 174,741 Other current assets 12,912 75 349 – – 13,336 6,620 Cash 3,198 3,285 3,596 20 – 10,099 4,049 Current liabilities (3,588) (3,971) (860) – – (8,419) (3,349) Bank debt (77,075) (60,328) (14,933) – – (152,336) (62,911) Unamortised finance costs 1,068 1,011 29 – – 2,108 854 Derivative financial instruments (713) 86 (19) – – (646) (338) Net assets 101,137 63,843 124,037 20 – 289,037 119,666 Group share 50% 30.5% 40% 50% – Group share of net assets 50,569 19,472 49,615 10 – 119,666
Metric Income Plus Partnership £000 LMP Retail Warehouse JV PUT £000 LSP London Residential Investments £000 LSP Green Park Distribution Holdings £000 LSP Green Park Trust £000 Total 2015 £000 Group share 2015 £000
SLIDE 49
LondonMetric Property Plc 49
Summarised income statement 100% 100% 100% 100% 100% 100% Net rental income 11,953 12,736 2,668 6,297 – 33,654 13,337 Administration expenses (122) (22) (130) (4) (100) (378) (141) Management fees (874) (493) (538) (260) (213) (2,378) (949) Revaluation gain 7,020 7,821 400 2,457 – 17,698 5,982 Finance income 18 8 4 1 – 31 13 Finance cost (3,283) (1,863) (2,559) (585) – (8,290) (3,251) Movement in derivatives (1,683) (390) (352) 21 – (2,404) (1,105) (Loss)/profit on disposal (427) 1,916 (595) – 1,089 1,983 417 Tax – – – (62) – (62) – Profit/(loss) after tax 12,602 19,713 (1,102) 7,865 776 39,854 14,303 EPRA adjustments Revaluation gain (7,020) (7,821) (400) (2,457) – (17,698) (5,982) Movement in derivatives 1,683 390 352 (21) – 2,404 1,105 Loss/(profit) on disposal 427 (1,916) 595 – (1,089) (1,983) (475) Debt and hedging early close out costs – – 146 – – 146 58 EPRA earnings 7,692 10,366 (409) 5,387 (313) 22,723 9,009 Summarised balance sheet Investment properties 212,430 147,995 166,134 36,878 – 563,437 236,245 Other current assets 1,448 25 336 – 24 1,833 873 Cash 21,275 1,821 2,309 1,253 979 27,637 13,051 Current liabilities (7,544) (1,725) (1,153) (640) (1,003) (12,065) (5,397) Bank debt (102,500) (71,800) (42,464) (14,890) – (231,654) (97,579) Unamortised finance costs 1,527 1,546 275 67 – 3,415 1,378 Derivative financial instruments (375) 274 (124) (105) – (330) (205) Net assets 126,261 78,136 125,313 22,563 – 352,273 148,366 Group share 50% 30.5% 40% 50% 31.4% Group share of net assets 63,131 23,829 50,125 11,281 – 148,366
11 Trade and other receivables
As at 31 March 2016 £000 2015 £000
Trade receivables 1,771 2,847 Amounts receivable from property sales 11,402 337 Prepayments and accrued income 2,744 1,744 Other receivables 132 2,313 16,049 7,241 All amounts fall due for payment in less than one year. Trade receivables comprise rental income which is due on contractual quarter days with no credit period. At 31 March 2016 there were no trade receivables which were overdue and considered at risk (2015: £225,000). A full provision was made against these trade receivables in the previous year.
12 Cash and cash equivalents
Cash and cash equivalents include £4.9 million (2015: £8.2 million) retained in rent and restricted accounts which are not readily available to the Group for day to day commercial purposes.
SLIDE 50 LondonMetric Property Plc 50
13 Trade and other payables
As at 31 March 2016 £000 2015 £000
Trade payables 4,780 8,404 Amounts payable on property acquisitions and disposals 9,595 5,193 Rent received in advance 12,160 8,953 Accrued interest 1,897 2,772 Other payables 525 593 Other accruals 6,386 6,056 35,343 31,971 The Group has financial risk management policies in place to ensure that all payables are paid within the credit timeframe.
14 Borrowings and financial instruments
a) Non current financial liabilities
As at 31 March 2016 £000 2015 £000
Secured bank loans 179,989 465,450 Unsecured bank loans 395,000 – Unamortised finance costs (7,079) (3,195) 567,910 462,255 Of the total bank loans at 31 March 2016, £180.0 million are secured by fixed charges over certain of the Group’s investment properties with a carrying value of £360.3 million. On 1 April 2015 the Company agreed a new £400 million unsecured revolving credit facility with a syndicate of five lending banks and replaced five secured facilities. In November 2015 this facility was increased to £443.8 million. b) Financial risk management Financial risk factors The Group’s overall risk management programme focuses on the unpredictability of financial markets and seeks to minimise potential adverse effects on the Group’s financial performance. The Group’s financial risk management objectives are to minimise the effect of risks it is exposed to through its operations and the use of debt financing. The principal financial risks to the Group and the policies it has in place to manage these risks are summarised below: i) Credit risk Credit risk is the risk of financial loss to the Group if a client or counterparty to a financial instrument fails to meet its contractual obligations. The Group’s principal financial assets are cash balances and deposits and trade and other
- receivables. The Group’s credit risk is primarily attributable to its cash deposits and trade
receivables. The Group mitigates financial loss from tenant defaults by dealing with only creditworthy tenants. The trade receivable amounts presented in the balance sheet are net of allowances for doubtful
- receivables. An allowance for impairment is made where there is objective evidence that the Group
will not be able to collect amounts due according to the original terms of the receivables concerned. The balance is low relative to the scale of the balance sheet and therefore the credit risk of trade receivables is considered to be low.
SLIDE 51 LondonMetric Property Plc 51
Cash is placed on deposit with a diverse mix of institutions with suitable credit ratings and rates of return and for varying periods of time. The credit ratings of the banks are monitored and changes are made where necessary to manage risk. The credit risk on liquid funds and derivative financial instruments is limited due to the Group’s policy of monitoring counterparty exposures with a maximum exposure equal to the carrying amount of these instruments. The Group has no significant concentration of credit risk, with exposure spread over a large number of counterparties. ii) Liquidity risk Liquidity risk arises from the Group’s management of working capital and the finance charges and principal repayments on its debt instruments. It is the risk that the Group will encounter difficulty in meeting its financial obligations as they fall due. The Group actively maintains a mixture of long-term and short-term committed facilities that are designed to ensure that the Group has sufficient available funds for operations and committed
- investments. The Group’s funding sources are diversified across a range of banks. Weekly cash flow
forecasts are prepared for the Executive Committee to ensure sufficient resources of cash and undrawn borrowing facilities are in place to meet liabilities as they fall due. The Group had cash reserves of £42.6 million (2015: £50.6 million) and available and undrawn bank loan facilities at 31 March 2016 of £64.9 million (2015: £72.2 million). The following table shows the contractual maturity profile of the Group’s financial liabilities on an undiscounted cash flow basis and assuming settlement on the earliest repayment date.
As at 31 March 2016 Less than
£000 One to two years £000 Two to five years £000 More than five years £000 Total £000
Bank loans 14,358 14,358 43,112 578,087 649,915 Derivative financial instruments 5,750 6,279 18,389 5,767 36,185 20,108 20,637 61,501 583,854 686,100
As at 31 March 2015 Less than
£000 One to two years £000 Two to five years £000 More than five years £000 Total £000
Bank loans 13,043 100,833 202,319 204,195 520,390 Derivative financial instruments 3,506 3,619 6,958 2,260 16,343 16,549 104,452 209,277 206,455 536,733 iii) Market risk – interest rate risk The Group is exposed to interest rate risk from the use of debt financing at a variable rate. It is the risk that future cash flows of a financial instrument will fluctuate because of changes in interest
- rates. It is Group policy that a reasonable portion of external borrowings are at a fixed interest rate
in order to manage this risk. The Group uses interest rate swaps and caps to manage its interest rate exposure and hedge future interest rate risk for the term of the bank loan. Although the Board accepts that this policy neither protects the Group entirely from the risk of paying rates in excess of current market rates nor eliminates fully the cash flow risk associated with interest payments, it considers that it achieves an appropriate balance of exposure to these risks. At 31 March 2016 the Group (excluding share of joint ventures) had £524.6 million (2015: £364.6 million) of hedges in place, and its debt of £575.0 million (2015: £465.5 million) was 91.2% (2015: 78%) hedged by way of interest rate swaps and caps. Consequently, based on year-end debt levels, a 1% change in interest rates would decrease or increase the Group’s annual profit before tax by £2.5 million and £1.5 million respectively. Including its share of joint ventures the Group had £593.1 million (2015: £450.5 million) of hedges in place and its debt of £637.9 million (2015: £563.0 million) was 93.0% (2015: 80%) fixed.
SLIDE 52
LondonMetric Property Plc 52
The average interest rate payable by the Group (including share of joint ventures) on all bank borrowings at 31 March 2016 including the cost of amortising finance arrangement fees was 3.5% (2015: 3.7%). iv) Capital risk management The Group’s objectives when maintaining capital are to safeguard the entity’s ability to continue as a going concern so that it can provide returns to shareholders and as such it seeks to maintain an appropriate mix of debt and equity. The capital structure of the Group consists of debt, which includes long-term borrowings and undrawn debt facilities, and equity comprising issued capital, reserves and retained earnings. The Group balances its overall capital structure through the payment of dividends, new share issues as well as the issue of new debt or the redemption of existing debt. c) Financial instruments i) Categories of financial instruments
Loans and receivables As at 31 March 2016 £000 2015 £000
Current assets Cash and cash equivalents (note 12) 42,621 50,568 Trade receivables (note 11) 1,771 2,847 Other receivables (note 11) 132 2,313 44,524 55,728
Measured at amortised cost Measured at fair value As at 31 March 2016 £000 2015 £000 2016 £000 2015 £000
Non current liabilities Borrowings (note 14) 567,910 462,255 – – Current liabilities Trade payables (note 13) 4,780 8,404 – – Accrued interest (note 13) 1,897 2,772 – – Other accruals (note 13) 6,386 6,056 – – Other payables (note 13) 525 593 – – Derivative financial instruments (see 14c(iii)) – – 23,570 6,870 581,498 480,080 23,570 6,870 ii) Fair values To the extent financial assets and liabilities are not carried at fair value in the Consolidated Balance Sheet, the Directors are of the opinion that book value approximates to fair value at 31 March 2016. iii) Derivative financial instruments Details of the fair value of the Group’s derivative financial instruments that were in place at 31 March 2016 are provided below:
As at 31 March Average rate Notional amount Fair value Interest rate caps – expiry 2016 % 2015 % 2016 £000 2015 £000 2016 £000 2015 £000
Less than one year 2.4 4.0 77,500 4,000 – – One to two years 2.0 2.3 16,313 101,000 4 3 Two to five years 2.1 2.1 110,000 126,313 128 721 More than five years 2.0 2.0 18,150 18,150 234 537 2.2 2.2 221,963 249,463 366 1,261
SLIDE 53
LondonMetric Property Plc 53 As at 31 March Average rate Notional amount Fair value Interest rate swaps – expiry 2016 % 2015 % 2016 £000 2015 £000 2016 £000 2015 £000
Less than one year 3.3 – 10,500 – (12) – One to two years 3.2 2.1 16,313 28,084 (624) (297) Two to five years 2.9 2.3 60,000 178,420 (3,185) (4,243) More than five years 1.9 2.0 467,290 187,290 (20,115) (3,591) 2.1 2.1 554,103 393,794 (23,936) (8,131) Total fair value (23,570) (6,870) All derivative financial instruments are non current interest rate derivatives, and are carried at fair value following a valuation as at 31 March 2016 by J C Rathbone Associates Limited. The market values of hedging products change with interest rate fluctuations, but the exposure of the Group to movements in interest rates is protected by way of the hedging products listed above. In accordance with accounting standards, fair value is estimated by calculating the present value of future cash flows, using appropriate market discount rates. For all derivative financial instruments this equates to a Level 2 fair value measurement as defined by IFRS 13 Fair Value Measurement. The valuation therefore does not reflect the cost or gain to the Group of cancelling its interest rate protection at the balance sheet date, which is generally a marginally higher cost (or smaller gain) than a market valuation.
15 Commitments under operating leases
The Group’s minimum lease rentals receivable under non cancellable operating leases, excluding joint ventures, are as follows:
As at 31 March 2016 £000 2015 £000
Less than one year 73,090 66,168 Between one and five years 288,518 281,345 Between six and ten years 287,566 280,081 Between 11 and 15 years 186,977 181,610 Between 16 and 20 years 82,761 97,418 Over 20 years 43,387 49,383 962,299 956,005 The Group’s minimum lease payments under non cancellable operating leases, excluding joint ventures, are as follows:
As at 31 March 2016 £000 2015 £000
Less than one year 810 812 Between one and five years 1,147 1,958 1,957 2,770
16 Share capital
As at 31 March 2016 Number 2016 £000 2015 Number 2015 £000
Authorised Ordinary shares of 10p each Unlimited Unlimited Unlimited Unlimited
As at 31 March 2016 Number 2016 £000 2015 Number 2015 £000
Issued, called up and fully paid Ordinary shares of 10p each 628,043,905 62,804 628,043,905 62,804 In June 2015, the Company granted options over 2,303,891 ordinary shares under its Long Term Incentive Plan and Deferred Bonus Plan and 236,733 ordinary shares in the Deferred Bonus Plan vested.
SLIDE 54 LondonMetric Property Plc 54
17 Reserves
The following describes the nature and purpose of each reserve within equity: Share capital The nominal value of shares issued. Capital redemption reserve Amounts transferred from share capital on redemption of issued
Other reserve A reserve relating to the application of merger relief in the acquisition
- f LondonMetric Management Limited and Metric Property
Investments plc by the Company, the cost of the Company’s shares held in treasury and the cost of shares held in trust to provide for the Company’s future obligations under share award schemes. Retained earnings The cumulative profits and losses after the payment of dividends.
18 Related party transactions and balances
Management fees and dividends receivable from the Group’s joint venture arrangements in which it has an equity interest were as follows: For the year to 31 March
Management fees Dividends Group interest 2016 £000 2015 £000 2016 £000 2015 £000
LSP Green Park Property Trust 31.4% – 46 231 275 LSP Green Park Distribution Holdings 50.0% 92 260 11,210 511 LSP London Residential Investments 40.0% 458 449 – 2,400 Metric Income Plus Partnership 50.0% 1,216 962 4,161 2,866 LMP Retail Warehouse JV Property Unit Trust 30.5% 425 494 3,526 13,472 2,191 2,211 19,128 19,524 Transactions between the Company and its subsidiaries which are related parties have been eliminated on consolidation.
19 Events after the balance sheet date
On 7 April 2016 the Group’s MIPP joint venture exchanged contracts to dispose of a 33,000 sq ft store let to The Range in Bridgwater for £4.9 million. On 28 April 2016 the Group completed the disposal of its Odeon property in Taunton for £9.1 million. On 5 May 2016 the Group acquired a distribution unit in Basildon for £3.8 million. On 9 May 2016 the Group’s MIPP joint venture completed the disposal of its 26,000 sq ft property in Chatham let to Wickes for £6.9 million. On 25 May 2016 the MIPP joint venture completed the disposal of a 21,000 sq ft unit in Grimsby let to Wickes for £4.1 million. On 25 May 2016 the Group exchanged contracts to acquire a 112,000 sq ft development site in Crawley for £7.6 million.
SLIDE 55
LondonMetric Property Plc 55
Supplementary information (not audited)
i EPRA Summary table
2016 2015
EPRA earnings 7.8p 6.6p EPRA net asset value 147.7p 140.6p EPRA triple net asset value 143.9p 139.4p EPRA vacancy rate 0.7% 0.3% EPRA cost ratio (including vacant property costs) 17% 19% EPRA cost ratio (excluding vacant property costs) 17% 17% EPRA net initial yield 4.9% 4.9% EPRA “topped up” net initial yield 5.4% 5.8%
ii EPRA proportionally consolidated income statement
For the year to 31 March Group £000 JV £000 2016 £000 Group £000 JV £000 2015 £000
Gross rental income 67,948 11,084 79,032 60,192 13,844 74,036 Property costs (830) (515) (1,345) (2,582) (507) (3,089) Net income 67,118 10,569 77,687 57,610 13,337 70,947 Management fees 2,191 (865) 1,326 2,211 (949) 1,262 Administrative costs (13,636) (172) (13,808) (12,502) (141) (12,643) Net finance costs (13,789) (2,947) (16,736) (15,384) (3,238) (18,622) Other (18) – (18) (35) – (35) EPRA earnings 41,866 6,585 48,451 31,900 9,009 40,909
iii EPRA proportionally consolidated balance sheet
As at 31 March Group £000 JV £000 2016 £000 Group £000 JV £000 2015 £000
Investment property 1,346,110 174,741 1,520,851 1,164,140 236,245 1,400,385 Gross debt (574,989) (62,911) (637,900) (465,450) (97,579) (563,029) Cash 42,621 4,049 46,670 50,568 13,051 63,619 Other net (liabilities)/assets (11,641) 4,125 (7,516) (20,603) (3,146) (23,749) EPRA net assets 802,101 120,004 922,105 728,655 148,571 877,226 Loan to value 38% 34% 38% 36% 36% 36% Cost of debt 3.5% 3.6% 3.5% 3.7% 3.6% 3.7% Undrawn facilities 64,931 5,000 69,931 72,191 11,250 83,441
iv EPRA cost ratio
For the year to 31 March 2016 £000 2015 £000
Property operating expenses 830 2,582 Administration expenses 13,636 12,502 Share of joint venture property operating, administration expenses and management fees 1,552 1,597 Less:
SLIDE 56 LondonMetric Property Plc 56
Joint venture property management fee income (2,191) (2,211) Ground rents (59) (180) Total costs including vacant property costs (A) 13,768 14,290 Group vacant property costs (369) (1,199) Share of joint venture vacant property costs (292) (347) Total costs excluding vacant property costs (B) 13,107 12,744 Gross rental income Share of joint venture gross rental income 67,948 11,084 60,192 13,844 79,032 74,036 Less: Ground rents (59) (180) Total gross rental income (C) 78,973 73,856 Total EPRA cost ratio (including vacant property costs) (A)/(C) 17% 19% Total EPRA cost ratio (excluding vacant property costs) (B)/(C) 17% 17%
v EPRA net initial yield and “topped up” net initial yield
As at 31 March 2016 £000 2015 £000
Investment property – wholly-owned 1,346,110 1,164,140 Investment property – share of joint ventures 174,741 236,245 Less development properties (56,550) (131,095) Less residential properties (55,895) (69,573) Completed property portfolio 1,408,406 1,199,717 Allowance for: Estimated purchasers’ costs 95,772 69,584 Estimated costs to complete 43,967 33,754 EPRA property portfolio valuation (A) 1,548,145 1,303,055 Annualised contracted rental income 71,945 63,605 Share of joint ventures 8,064 12,222 Less development properties (3,972) (11,333) Less residential properties (856) (1,140) Annualised net rents (B) 75,181 63,354 Contractual rental increases for rent free periods 5,334 9,783 Contractual rental increases for fixed uplifts 3,641 1,855 “Topped up” net annualised rent (C) 84,156 74,992 EPRA net initial yield (B/A) 4.9% 4.9% EPRA “topped up” net initial yield (C/A) 5.4% 5.8%
vi EPRA Vacancy rate
As at 31 March 2016 £000 2015 £000
Annualised estimated rental value of vacant premises 604 255 Portfolio estimated rental value1 82,720 70,615 EPRA vacancy rate 0.7% 0.3%
1 Excludes residential and development properties
SLIDE 57 LondonMetric Property Plc 57
vii EPRA capital expenditure analysis
As at 31 March Group 2016 £000 JV 2016 £000 Total 2016 £000 Group 2015 £000 JV 2015 £000 Total 2015 £000
Opening valuation 1,164,140 236,245 1,400,385 1,030,553 189,205 1,219,758 Acquisitions 109,546 3,477 113,023 208,943 59,049 267,992 Developments1 104,955 – 104,955 21,557 – 21,557 Capital expenditure2 13,720 761 14,481 10,545 727 11,272 Disposals (128,493) (64,749) (193,242) (231,451) (22,854) (254,305) Revaluation 51,063 (1,276) 49,787 112,393 5,982 118,375 Lease incentives 31,179 283 31,462 11,600 4,136 15,736 Closing valuation 1,346,110 174,741 1,520,851 1,164,140 236,245 1,400,385
1 Includes capitalised interest of £2.7 million (2015: £1.6 million) 2 Capital expenditure on completed properties
viii Total accounting return
For the year to 31 March 2016 £000 2015 £000
EPRA net asset value – at end of year 922,105 877,226 – at start of year 877,226 756,970 Increase 44,879 120,256 Dividend paid 56,171 43,749 Increase including dividend 101,050 164,005 Total accounting return 11.5% 21.7%
ix Portfolio split and valuation
As at 31 March 2016 £m 2016 % 2015 £m 2015 %
Retail 474.8 31.2 490.7 35.0 Leisure 69.0 4.5 77.1 5.5 Distribution – retail 581.1 38.2 402.2 28.7 Distribution – non retail 203.3 13.4 156.4 11.2 Office 80.2 5.3 73.3 5.2 Investment Portfolio 1,408.4 92.6 1,199.7 85.6 Development – retail 16.6 1.1 32.8 2.4 Development – distribution 40.0 2.6 98.3 7.0 Residential 55.9 3.7 69.6 5.0 1,520.9 100.0 1,400.4 100.0 Retail (Group and JV split) Wholly-owned 360.5 75.9 345.3 70.4 Metric Income Plus Partnership 82.7 17.4 106.2 21.6 LMP Retail Warehouse JV Property Unit Trust 31.6 6.7 39.2 8.0 474.8 100.0 490.7 100.0
x Investment Portfolio yields
As at 31 March 2016 2015 EPRA NIY % EPRA topped up NIY % Equivalent yield % EPRA NIY % EPRA topped up NIY % Equivalent yield %
Retail 4.8 5.8 5.8 5.2 6.0 5.9 Leisure 6.0 6.0 7.0 6.1 6.2 7.4 Distribution 4.7 5.2 5.4 4.2 5.4 5.7 Office 5.3 5.6 6.6 6.3 6.3 6.2
SLIDE 58 LondonMetric Property Plc 58
Investment portfolio 4.9 5.4 5.7 4.9 5.8 5.9
xi Investment Portfolio – Key statistics
As at 31 March 2016 Area ‘000 sq ft WAULT to expiry years WAULT to first break years Occupancy % Average rent £ per sq ft
Retail 2,461 12.1 11.2 98.1 16.90 Leisure 289 21.3 21.3 100.0 15.30 Distribution – Retail 6,171 13.9 13.2 100.0 5.20 Distribution – Non Retail 1,634 11.1 10.4 100.0 6.85 Office 231 7.3 7.3 100.0 21.30 Investment portfolio 10,786 12.8 12.2 99.3 8.30 Distribution development1 1,180 Retail development 89 Total investment & development portfolio 12,055
1 Excludes conditional development site at Bedford.
xii Total property returns (%)
For the year to 31 March Core portfolio 2016 % All property 2016 % All property 2015 %
Capital return 5.2 4.9 11.1 Income return 5.5 5.3 5.8 Total return 10.9 10.5 17.5
xiii Contracted rental income
As at 31 March 2016 £m 2015 £m
Retail 31.3 31.6 Leisure 4.4 5.0 Distribution – retail 31.1 23.1 Distribution – non retail 11.2 8.8 Office 4.9 4.7 Investment portfolio 82.9 73.2 Development – retail 0.8 2.1 Development – distribution 2.5 9.2 Residential 0.9 1.1 Total portfolio 87.1 85.6
xiv Rent subject to expiry
As at 31 March 2016 Within 5 years % Within 10 years % Within 15 years % Within 20 years % Over 20 years %
Retail 7.0 33.7 76.4 91.4 100.0 Leisure – – 10.1 10.1 100.0 Distribution 5.1 37.7 58.0 88.1 100.0 Office 13.4 100.0 100.0 100.0 100.0 6.0 37.9 64.8 86.0 100.0
xv Contracted rent subject to RPI or fixed uplifts for investment portfolio (%)
As at 31 March 2016 £m 2016 % 2015 £m 2015 %
Retail 8.9 27.7 8.3 26.4 Leisure 4.4 100.0 5.0 100.0 Distribution 26.0 57.9 16.2 50.8 Office 3.0 60.9 3.0 64.1 Investment portfolio 42.3 49.0 32.5 44.4
SLIDE 59 LondonMetric Property Plc 59
xvi Top 10 assets (by value1)
As at 31 March 2016 Area ‘000 sq ft Contracted Rent £m Occupancy % WAULT to expiry years WAULT to first break years
Primark Distribution Centre, Islip 1,062 5.3 100 24.5 24.5 Dixons Carphone, Newark Distribution Centre 726 3.9 100 17.3 17.3 Primark Distribution Centre, Thrapston 783 4.0 100 16.5 16.5 Marlow International, Marlow 231 4.9 100 7.3 7.3 Argos, Bedford 658 3.8 100 6.7 6.7 Eddie Stobart, Dagenham 410 3.1 100 15.3 15.3 The Hut Group, Warrington 690 3.8 100 14.6 14.6 Royal Mail, Daventry 273 2.5 100 7.4 7.4 Kirkstall Bridge Shopping Park, Leeds 120 2.1 100 12.8 10.7 M&S, Sheffield 626 2.6 100 7.7 5.3
1 Excluding residential assets
xvii Top 10 Occupiers
As at 31 March 2016 Contracted rental income £m Market capitalisation £bn Contracted rental income %
Primark1 9.4 23.1 10.9 Dixons Carphone 5.5 5.1 6.4 M&S 5.3 7.2 6.1 Argos1 4.1 5.2 4.7 Odeon 4.0 Private 4.6 The Hut Group 3.8 Private 4.4 DFS 3.6 0.7 4.3 Royal Mail 3.2 4.9 3.8 Eddie Stobart 3.1 Private 3.5 Allergan 3.0 61.3 3.5 Top 10 45.0 52.2 Other commercial income 41.2 47.8 Total commercial 86.2 100.0 Residential income 0.9 Total Group income 87.1
1 Market capitalisation of parent company
Definitions
Building Research Establishment Environmental Assessment Methodology (BREEAM) A set of assessment methods and tools designed to help construction professionals understand and mitigate the environmental impacts of the developments they design and build Capital Return The valuation movement on the property portfolio adjusted for capital expenditure and expressed as a percentage of the capital employed over the period Contracted Rent The annualised rent adjusting for the inclusion of rent free periods Cost of debt Weighted average interest rate payable
SLIDE 60 LondonMetric Property Plc 60
Debt maturity Weighted average period to expiry of drawn debt Energy Performance Certificate (EPC) Required certificate whenever a property is built, sold or rented. An EPC gives a property an energy efficiency rating from A (most efficient) to G (least efficient) and is valid for 10 years. An EPC contains information about a property’s energy use and typical energy costs, and recommendations about how to reduce energy use and save money EPRA Cost Ratio Total operating costs as a percentage of gross rental income EPRA Earnings per Share (EPS) Recurring earnings from core operational activities divided by the average number of shares in issue
EPRA Like for Like Income Growth The movement in rental income on properties owned throughout the current and previous periods under review. The movement includes revenue recognition and lease accounting adjustments but excludes properties held for development and residential EPRA NAV per Share Balance sheet net assets excluding fair value of derivatives, divided by the number of shares in issue at the balance sheet date EPRA NNNAV per Share EPRA NAV per share adjusted to include the fair value of financial instruments, debt and deferred taxes at the balance sheet date EPRA net initial yield Annualised rental income based on cash rents passing at the balance sheet date, less non recoverable property operating expenses, expressed as a percentage of the market value of the property, after inclusion of estimated purchaser’s costs EPRA topped up net initial yield EPRA net initial yield adjusted for expiration of rent free periods or other lease incentives such as discounted rent periods and stepped rents EPRA Vacancy The Estimated Rental Value (ERV) of immediately available vacant space divided by total annualised income of the investment portfolio Equivalent Yield The weighted average income return expressed as a percentage of the market value of the property, after inclusion of estimated purchaser’s costs Estimated Rental Value (ERV) The external valuers’ opinion of the open market rent which, on the date of valuation, could reasonably be expected to be obtained on a new letting or rent review of a property European Public Real Estate Association (EPRA) The European Public Real Estate Association (EPRA) is the industry body for European Real Estate Investment Trusts (REITs) Group LondonMetric Property Plc and its subsidiaries IFRS The International Financial Reporting Standards issued by the International Accounting Standards Board and adopted by the European Union
SLIDE 61
LondonMetric Property Plc 61
Income Return Net rental income expressed as a percentage of capital employed over the period Investment Portfolio The Group’s property portfolio excluding development, land holdings and residential properties Investment Property Databank (IPD) Investment Property Databank (IPD) is a wholly owned subsidiary of MSCI producing an independent benchmark of property returns and the Group’s portfolio returns Loan to Value (LTV) Net debt expressed as a percentage of the total property portfolio value at the period end Net Rental Income The rental income receivable after deduction for ground rents and other net property outgoings including void costs and net service charge expenses Occupancy Rate The ERV of the let units as a percentage of the total ERV of the investment portfolio Omni Channel Retailing The evolution of multi channel retailing providing a seamless shopping experience for the consumer through all available shopping channels, ie physical, internet, mobile, social media, telephone, catalogue etc Passing Rent The gross rent payable by tenants under operating leases, less any ground rent payable under head leases Property Income Distribution (PID) Dividends from profits of the Group’s tax-exempt property business under the REIT regulations. The PID dividend is paid after deducting withholding tax at the basic rate Real Estate Investment Trust (REIT) A listed property company which qualifies for and has elected into a tax regime which is exempt from corporation tax on profits from property rental income and UK capital gains on the sale of investment properties Total Accounting Return (TAR) The movement in EPRA NAV plus the dividend paid during the period expressed as a percentage of the EPRA NAV at the beginning of the period Total Property Return (TPR) Unlevered weighted capital and income return of the property portfolio as calculated by IPD Total Shareholder Return (TSR) The movement in the ordinary share price as quoted on the London Stock Exchange plus dividends per share assuming that dividends are reinvested at the time of being paid Weighted Average Interest Rate The total loan interest and derivative costs per annum (including the amortisation of finance costs) divided by the total debt in issue at the period end Weighted Average Unexpired Lease Term (WAULT) Average unexpired lease term across the investment portfolio weighted by net rental income