
SLIDE 1
lamprell.com
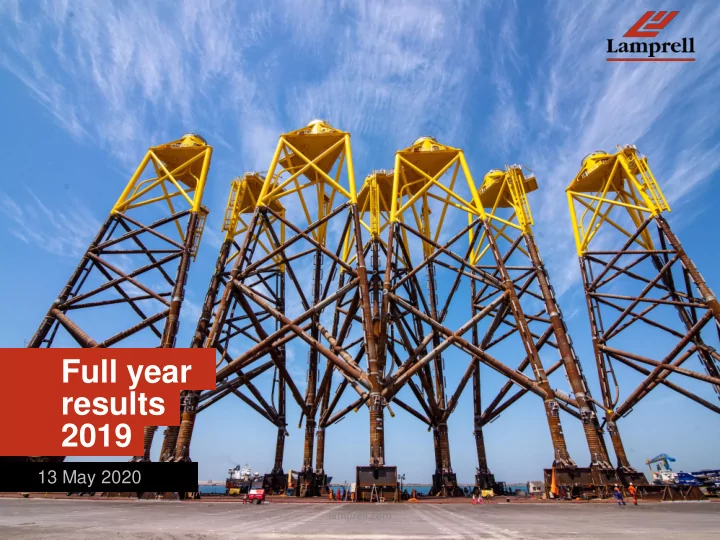
Full year results 2019 13 May 2020 lamprell.com Disclaimer This - - PowerPoint PPT Presentation
Full year results 2019 13 May 2020 lamprell.com Disclaimer This presentation contains certain forward-looking statements relating to the business, financial performance and results of the Company and/ or the industry in which it operates.
lamprell.com
2 This presentation contains certain forward-looking statements relating to the business, financial performance and results of the Company and/ or the industry in which it operates. Forward-looking statements concern future circumstances and results and other statements that are not historical facts, sometimes identified by the words “believes”, “expects, “predicts”, ”intends”, “projects”, “plans” “estimates”, “aims”, “foresees”, anticipates”, “targets” and similar expressions. The forward-looking statements, contained in this document, including assumptions, opinions and views of the Company or cited from third party sources are solely opinions and forecasts which are uncertain and subject to
anticipated development. Neither the Company nor any of its officers or employees guarantees that the assumptions underlying such forward-looking statements are free from errors nor does any of the foregoing accept any responsibility for the future accuracy of the
developments. No representation or warranty (express or implied) is made as to, and no reliance should be placed on, any information, including projections, estimates, targets and opinions, contained herein, and no liability whatsoever is accepted as to any errors, omissions or misstatements contained herein, and, accordingly, neither the Company nor any of its subsidiary undertakings nor any such person’s officers or employees accepts any liability whatsoever arising directly or indirectly from the use of this document.
3
l a m p r e l l . c o m
Moray East transition piece lifting
▪ Operations adapted to crisis, able to avoid major delays ▪ Additional short term cost cutting measures implemented
5
Oil and Gas ▪ Established presence and high local content scores in the region with lowest cost reserves ▪ Offshore capex in Saudi Arabia and UAE will continue ▪ Strategic partnerships and long standing relationships in both markets Renewables ▪ Developing expertise in an industry with rapid global growth ▪ Requirement for 3000 foundations in the next 5 years ▪ Few yards with the right capacity, set-up and solid delivery track record
▪ Significant cost reduction from a major operational restructuring in 2020 ▪ EA1 settlement and release of restricted cash ▪ Deferring equity contribution into IMI until 2021 ▪ Capex reduction ▪ Actively pursuing various funding options ▪ Track record in renewables improves access to funding
6
7
▪ Operations to be consolidated within one
yard (Hamriyah) with potential increase in yard space if required:
▪ Reduces cost base ▪ Delivers operational efficiencies ▪ Flexible
capacity to deliver the pipeline
▪ Jebel Ali facility mothballed, exit Sharjah
facility upon completion of Moray East project
▪ Significant
headcount reductions took place in Q1
▪ Spending
and allowance thresholds reduced/ work week extended
▪ Retained capacity and skillset to deliver
strategic initiatives
▪ Total overhead reduction of $22m for FY
2020
8
Impact on operations
▪ Increased health screening ▪ UAE industrial work continues, close
collaboration with government authorities
▪ Work in the yards continues with moderate
impact on productivity and cost
▪ Current projects progressing in line with
schedule Impact on supply chain
▪ Working closely with suppliers and
potential clients to mitigate impact on
Temporary cost reduction
▪ Salary reductions of 25% for 6 months ▪ Reduced working hours where possible ▪ Redundancies ▪ Anticipated saving of $10m for FY 2020
9
l a m p r e l l . c o m
Hamriyah
1 0
Bid Pipeline*
Backlog*
Net Cash*
Revenue
Net loss
***Total recordable injury rate * As at 31 December 2019
EBITDA
TRIR***
One-off impacts ▪Share of EA1 loss: $28.8m ▪Non-cash impairment: $79.3m ▪31 March 2020: $77m** ▪Balance sheet supports backlog ▪Modest YoY growth ▪ Several awards deferred into 2020 ▪Commendable performance in line with industry best practice ▪ High-quality pipeline with opportunities in both end markets
** Including $35m restricted cash
l a m p r e l l . c o m
Moray East preparation for load out
1 2
Moray East
▪ Project progressing as planned ▪ Significant improvement in efficiencies as a result of incremental
yard infrastructure investment
▪ Up-ending and load out campaign underway ▪ Final deliveries in early Q3 2020 ▪ Project provides strong platform for future wins
Rig refurbishment
▪ 13 completed in 2019 ▪ 8 stacked ▪ 1 larger scope project arrived at the yard ▪ Active major upgrade interest from the region
13
Project scope
▪ Two new build jack up rigs for ARO Drilling ▪ To be built mainly in Lamprell’s facilities, with
final commissioning in Saudi Arabia
▪ Lamprell’s share of the project amounting to
circa $350m
▪ Received initial milestone payment of $88m
in January 2020
▪ Project will utilize jacking kits from existing
inventory, which will convert approximately $70m of inventory into cash over the project’s execution IMI Maritime Yard progress
▪ Dredging, reclamation and marine structures
nearly completed, commenced yard facilities construction
▪ Lamprell’s investment to date - $59m (of
$140 total committed).
▪ Discussions to defer 2020 investment of
$26m commenced IMI DELIVERABLES TO DATE
▪ Investment in yard provides significant boost
to IKTVA score – a key requirement for contracts
▪ IKTVA score was a key decision maker in
LTA inclusion
▪ First two IMI jackup rigs are the only global
awards in 5 years
*IKTVA – In-Kingdom Total Value Added
14
Saudi Aramco LTA programme
▪ Bidding continues, do not anticipate current LTA
projects to be affected by the announced Capex cut
▪ 10 CRPOs submitted since joining LTA in
November 2018 (3 awarded, none to new entrants)
▪ 3 active bids ongoing ▪ Looking
at ways to further increase local content commitment
*LTA - Long-Term Agreement CRPO – Contract Release and Purchase Order
Jacket Topside Replacement deck module
CRPO SCOPE EXAMPLE
15
Renewables
▪ Bidding levels remain robust with significant
growth anticipated over the decade
▪ COVID-19 affected timing of decision on several
projects Oil and gas
▪ Discussions with regional clients continue, with
encouraging interest in new build and major rig upgrades
▪ Saudi Aramco’s LTA programme to be extended to
major packages on a major project
*Including LTA; as per 31 December 2019
$1.4bn $4.8bn
Renewables Oil and gas
l a m p r e l l . c o m
Moray East project construction in Hamriyah Facility
▪ YoY revenue increase driven by ramp-up on Moray East project ▪ Non-cash impairment charges of $79.3m a significant contributor to losses in the year ▪ Revenue below break even point and EA1 settlement also contribute to losses ▪ 2019 overhead increase in line with guidance, targeting 20% reduction in 2020 as a
result of self help measures
▪ Retained net cash position, debt free as of 11 March 2020, refinancing options in
progress, EA1 settlement improves liquidity
Income statement ($m, unless stated otherwise) FY 2019 FY 2018 Revenue 260.4 234.1 EBITDA (64.6) (35.1) EBITDA margin (24.8)% (15.0)% Loss from continuing operations after income tax (183.5) (70.7) Loss from continuing operations after income tax and excluding impairments (104.2) Balance sheet ($m) Net cash as at 31 December 42.5 80.0 Tangible net assets 211.4 363.0
Revenue by segment FY2019$m FY2018$m Rigs 24.8 76.0 EPC(I) 167.2 99.8 Contracting services 68.4 58.3
17
18
Amounts in US$m
(35.1) (64.6) 18.4 28.8 7.7 10.0 1.4
(70) (60) (50) (40) (30) (20) (10)
Impact of Moray Firth contribution in 2019 Impact of EA1 in 2019 Impact of reduced revenues and margin in other value streams Increase in Overheads Other 2019 EBITDA
19
*Non cash: Depreciation, amortization, finance lease costs
Delivered overhead savings in Q1 2020
▪ Target overheads of $82m in 2020 ▪ Cash overheads to be reduced by 28% ▪ Major
reductions in corporate
mainly driven by reduction in headcount
▪ Yard
consolidation drives
▪ One off restructuring costs of $8m excluded
Impact of COVID-19 savings on overhead
▪
Cash overheads reduced by a minimum of a further 8%
▪
Critical to preserving liquidity
20 30 40
Yard Overhead Operational Support Overhead Business Unit Overhead Corporate Overhead Asset Management Overhead
Cash overheads
2019 2020
70.6 33.3
Cost Structure 2019 $m
Cash Non Cash*
20
Amounts in US$m
80.0 40.7 45.6 20.9 11.7 42.5
20.0 30.0 40.0 50.0 60.0 70.0 80.0 90.0 100.0 110.0 120.0 130.0 Net Cash as at 31st December 2018 Movement in working capital Operating cash flows Asset additions Other Net Cash as at 31st December 2019
21
Operational capital expenditure
▪ Capital expenditure in 2019 amounted to
$21m
▪ Modest
2020 capital expenditure anticipated Strategic investments
▪ No investment was called for by IMI in
2019
▪ IMI investment of $26m under discussion
for deferral to 2021
20 40 26 35 19 140 2017 2018 2019 2020 2021 2022 2023 Total
ANNUAL IMI EQUITY INVESTMENTS ($ m)
22
▪ Balance sheet continues to support current projects ▪ Strong asset base to support future growth ▪ Tight control of strategic spend in 2020 ▪ Debt free as of 11 March 2020 but regional credit market, the global health crisis and the oil price volatility makes conventional term debt challenging ▪ Alternative sources of funding under consideration ▪ Overhead reductions to preserve our cash position
l a m p r e l l . c o m
Stacked rigs - Hamriyah
24
Solidify position in core markets Maintain continuity of renewables work and secure new build and refurbishment work for our offshore and
Move up the value chain in EPC(I) Enter new geographies and markets Leverage our position in renewables and on Saudi Aramco’s LTA programme to move further into EPC(I) execution Build on entry into Saudi Arabian market by securing new contract awards; pursue prospects in the renewables market, either with new clients or in new geographies Improve our business through innovation and digital technologies Leverage Lamprell’s core fabrication and project execution skill set into digital product offerings
25
50 100 150 200 250 300 350 2018 2025E 2030E 2040 E GW EU China US RoW
▪ Annual offshore wind capacity is set to double over
the next five years and increase almost 15x by 2040
▪ Europe leading the way but strong international
growth, supported by government policies
▪ Over 3000 foundations anticipated to be installed
5 years (Lamprell’s fabrication focus
foundations - ca 20% of capex)
▪ Assessing market for transition piece packages for
monopiles
OFFSHORE WIND TO GROW ~15x BY 2040
Note: Estimate based on IEA Stated Policies Scenario, further upside based on IEA Sustainable Development Scenario Sources: Fearnley Securities, IEA Offshore Wind Outlook 2019
~ 15x ~ 3.5x ~ 8x
FIXED FOUNDATIONS
Gravity- based Monopile Tripile Tripod Jacket
Lamprell focus
Transition piece
26
▪ Saudi
Aramco announced substantial
programme
▪ ADNOC
announced a major rig fleet expansion in support of its 2030 smart growth plan – dozens of land and offshore rigs to be ordered by 2025
▪ Potential for major offshore rig upgrade
work as ADNOC seeks to utilize available rigs
▪ Lamprell maintains one of the highest
local content scores in both markets
▪ Traditional fuels will remain part of the
energy mix for the foreseeable future presenting an opportunity for disciplined and highly skilled contractors
27
▪ Use innovation to improve our operations
and develop new revenue streams:
▪ Increased use of digital solutions on site (health performance metrics, face recognition, etc) to improve labour efficiencies ▪ Development of robotic solutions ▪ Asset integrity, digital twins and remote
▪ Two partnerships established to advance
digital strategy:
▪ JV with Injazat (Mubadala), regional digital
leader
▪ MOU with Akselos, a specialist in digital
twin solutions
28
Guiding principles
▪ Health & Safety of our employees ▪ Protocols in place in line with WHO and UAE govt ▪ Protect net cash and improve liquidity ▪ Self
help measures implemented to lower EBITDA breakeven level
▪ Settled EA1 ▪ Discussions underway to defer IMI equity injection until
2021
▪ Net cash position ▪ Debt free with over $200m in unencumbered assets ▪ Alternative sources of funding under consideration ▪ Strategy remains unchanged ▪ 2020 secured revenue of $275m
l a m p r e l l . c o m
Moray East project sail away
30
Amounts in $m FY 2019, $m Reported FY 2018 $m Reported Revenue 260.4 234.1 Cost of sales (288.0) (243.2) Gross loss (27.6) (9.1) Gross margin % (10.6%) (3.9%) G&A : (140.3) (45.2)
(79.3)
(61.0) (45.2) Operating loss (169.1) (55.4) Finance costs - net* (7.3) (3.5) Share of loss in investments accounted using the equity method (7.9) (10.6) Loss before income tax (184.4) (69.5) Income tax expense 0.9 (1.2) Loss for the period (183.5) (70.7) Total loss attributable to equity holders (183.5) (70.7)
* Represents the net balance of finance costs and finance income
31
Months 1-8: Low revenue recognition period/no profit until 20% progress achieved Months 9-20: High revenue recognition period with a gradual release of contingencies Months 21-30: Contribution to profit from final contingencies release Negative Positive Cumulative CF of a renewable project Revenue recognized Cumulative CF of an LTA project CF of a jackup project