
SLIDE 1
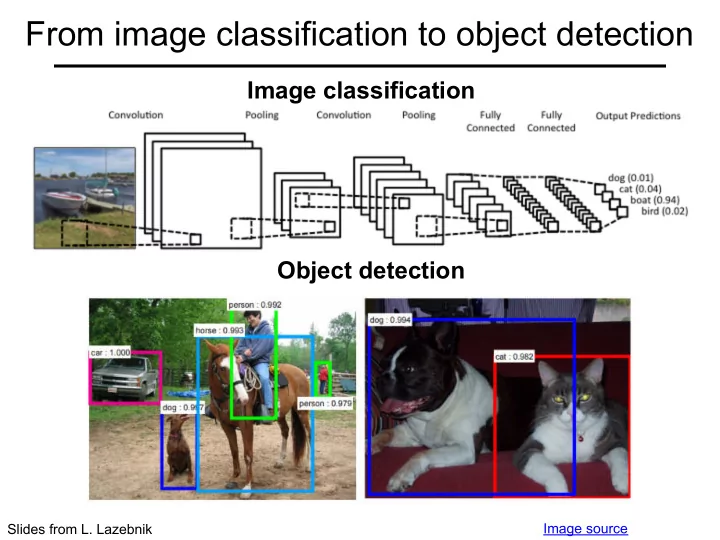
From image classification to object detection
Object detection
Image source
Image classification
Slides from L. Lazebnik
From image classification to object detection Image classification - - PowerPoint PPT Presentation
From image classification to object detection Image classification Object detection Image source Slides from L. Lazebnik What are the challenges of object detection? Images may contain more than one class, multiple instances from the same
Image source
Slides from L. Lazebnik
Image source
cat dog cat: 0.8 dog: 0.6 dog: 0.55
Ground truth (GT)
0% 10% 20% 30% 40% 50% 60% 70% 80%
2006 2007 2008 2009 2010 2011 2012
mean0Average0Precision0(mAP) year
Before CNNs PASCAL VOC
Detection
Image credit: N. Snavely
CVPR 2005
CVPR 2005
CVPR 2005 Template HOG feature map Detector response map
Slide by N. Snavely
Discriminatively Trained Part Based Models, PAMI 32(9), 2010
Discriminatively Trained Part Based Models, PAMI 32(9), 2010
Discriminatively Trained Part Based Models, PAMI 32(9), 2010
0% 10% 20% 30% 40% 50% 60% 70% 80%
2006 2007 2008 2009 2010 2011 2012 2013 2014 2015 2016
mean0Average0Precision0(mAP) year
Before CNNs After CNNs PASCAL VOC
Fixed-Scale Segmentation Rescaling & Alignment Combination
Resolution
Combinatorial Grouping
Image Pyramid Segmentation Pyramid Aligned Hierarchies Candidates Multiscale Hierarchy
Object Recognition, IJCV 2013
ECCV 2014
Input image ConvNet ConvNet ConvNet SVMs SVMs SVMs Warped image regions Forward each region through ConvNet Classify regions with SVMs Region proposals
Semantic Segmentation, CVPR 2014. Source: R. Girshick
ConvNet Forward whole image through ConvNet Conv5 feature map of image RoI Pooling layer Linear + softmax FCs Fully-connected layers Softmax classifier Region proposals Linear Bounding-box regressors
Source: R. Girshick
Source: R. Girshick, K. He
Image source
ConvNet Linear + softmax FCs Linear Log loss + smooth L1 loss Trainable Multi-task loss
Source: R. Girshick
softmax loss regression loss
Region proposal (a.k.a default box, prior, reference, anchor) Ground truth box Predicted box Target offset to predict* Predicted
Loss *Typically in transformed, normalized coordinates
Fast R-CNN R-CNN Train time (h) 9.5 84
8.8x 1x Test time / image 0.32s 47.0s Test speedup 146x 1x mAP 66.9% 66.0%
Timings exclude object proposal time, which is equal for all methods. All methods use VGG16 from Simonyan and Zisserman.
Source: R. Girshick
(vs. 53.7% for AlexNet)
CNN feature map Region proposals CNN feature map Region Proposal Network
Region Proposal Networks, NIPS 2015 share features
image
CNN feature map Region Proposal Network proposals RoI pooling Classification loss Bounding-box regression loss … Classification loss Bounding-box regression loss
Source: R. Girshick, K. He
0% 10% 20% 30% 40% 50% 60% 70% 80%
2006 2007 2008 2009 2010 2011 2012 2013 2014 2015 2016
mean0Average0Precision0(mAP) year
R-CNNv1 Fast R-CNN Before CNNs After CNNs Faster R-CNN
Conv feature map of the entire image Region Proposals RoI features RPN RoI pooling Classification + Regression Detections Conv feature map of the entire image Detections Classification + Regression
MultiBox Detector, ECCV 2016.
MultiBox Detector, ECCV 2016.
T.-Y. Lin, P. Dollar, R. Girshick, K. He, B. Hariharan, and S. Belongie, Feature pyramid networks for object detection, CVPR 2017.
T.-Y. Lin, P. Goyal, R. Girshick, K. He, P. Dollar, Focal loss for dense object detection, ICCV 2017.
T.-Y. Lin, P. Goyal, R. Girshick, K. He, P. Dollar, Focal loss for dense object detection, ICCV 2017.
T.-Y. Lin, P. Goyal, R. Girshick, K. He, P. Dollar, Focal loss for dense object detection, ICCV 2017.
C.-Y. Fu, W. Liu, A. Ranga, A. Tyagi, A. Berg, DSSD: Deconvolutional single-shot detector, arXiv 2017.
Input image ConvNet ConvNet ConvNet SVMs SVMs SVMs Warped image regions Forward each region through ConvNet Classify regions with SVMs Region proposals
Semantic Segmentation, CVPR 2014.
ConvNet Forward whole image through ConvNet “conv5” feature map of image “RoI Pooling” layer Linear + softmax FCs Fully-connected layers Softmax classifier Region proposals Linear Bounding-box regressors
CNN feature map Region proposals CNN feature map Region Proposal Network
Region Proposal Networks, NIPS 2015 share features
(30 = 20 + 2*(4+1))
Object Detection, CVPR 2016
MultiBox Detector, ECCV 2016.