
SLIDE 1
From Foodopoly: The Battle Over the Future of Food and Farming in America
From Foodopoly: The Battle Over the Future of Food and Farming in - - PowerPoint PPT Presentation
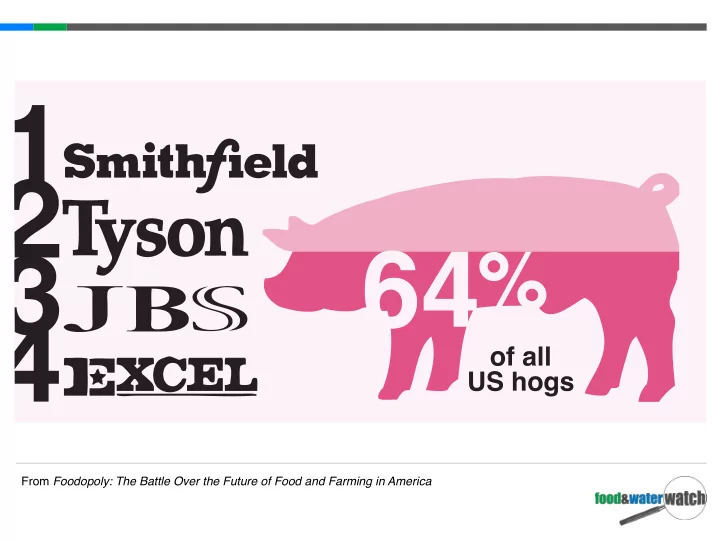
From Foodopoly: The Battle Over the Future of Food and Farming in America National Market Share of Top Four Hog Packers 65.0% 64.0% 55.0% 54.3% 43.8% 36.6% 35.8% 1982 1987 1992 1997
From Foodopoly: The Battle Over the Future of Food and Farming in America
Source: USDA GIPSA
1982 ¡ 1987 ¡ 1992 ¡ 1997 ¡ 2002 ¡ 2007 ¡ 2011 ¡
Source: USDA; Food & Water Watch The Cost of Food Monopolies
49,000 ¡ 38,600 ¡ 34,000 ¡ 18,400 ¡ 11,300 ¡ 8,800 ¡ 470 ¡ 584 ¡ 747 ¡ 1,454 ¡ 3,852 ¡ 5,068 ¡
Source: Food & Water Watch Factory Farm Nation; blue dots indicate big four hog processing plants
Map Color Hogs more than 48,500 19,000-48,500 9,500-18,999 fewer than 9,500 None
Source: USDA; Food & Water Watch The Cost of Food Monopolies
$241 ¡ ¡ $204 ¡ ¡ $145 ¡ ¡ $151 ¡ ¡ $100 ¡ ¡ $109 ¡ ¡ 101 ¡ 116 ¡ 128 ¡ 156 ¡ 162 ¡ 181 ¡
Iowa ¡Real ¡Hog ¡Price ¡(2010 ¡dollars ¡per ¡head) ¡ Pork ¡CPI ¡
Source: USDA, BLS; Food & Water Watch The Cost of Food Monopolies
(total real personal income in billions of 2010 dollars) $73.3 $78.6 $82.1 $93.4 $102.3 $112.9 $34.4 $37.8 $37.0 $32.3 $27.1 $27.8 1982 1987 1992 1997 2002 2007
Statewide Large Hog Farm Counties Source: USDA; BEA; Food & Water Watch The Cost of Food Monopolies