
SLIDE 1
Forward-Looking Statement This presentation contains forward-looking - - PowerPoint PPT Presentation
Forward-Looking Statement This presentation contains forward-looking statements that are subject to risks and uncertainties. These statements often include words such as believe, expect, anticipate, intend, plan,
This presentation contains forward-looking statements that are subject to risks and uncertainties. These statements
particular, this presentation contains forward-looking statements about Company estimates for future periods with respect to cost savings, restructuring charges, revenues or other financial information. These statements are based
under the circumstances. Actual results may differ materially from the anticipated results because of certain risks and uncertainties, including but not limited to: (i) general economic or business conditions affecting the markets in which the Company serves; (ii) the Company's ability to develop or successfully introduce new products; (iii) risks associated with conducting business in foreign countries and currencies; (iv) increased competition in the heavy-duty truck market and other key end markets; (v) our failure to complete or successfully integrate additional strategic acquisitions; (vi) the impact of changes in governmental regulations on the Company's customers or on its business; (vii) the loss of business from a major customer or the discontinuation of particular commercial vehicle platforms; (viii) the Company’s ability to obtain future financing due to changes in the lending markets or its financial position; (ix) our ability to comply with the financial covenants in our revolving credit facility; and (x) various other risks as
events will be achieved. CVG undertakes no obligation to update or revise forward-looking statements to reflect changed assumptions, the occurrence of unanticipated events or changes to future operating results over time. All subsequent written and oral forward-looking statements attributable to CVG or persons acting on behalf of CVG are expressly qualified in their entirety by such cautionary statements. For a complete description of risks, please refer to our 2010 Annual Report on Form 10-K and current SEC reports on file.
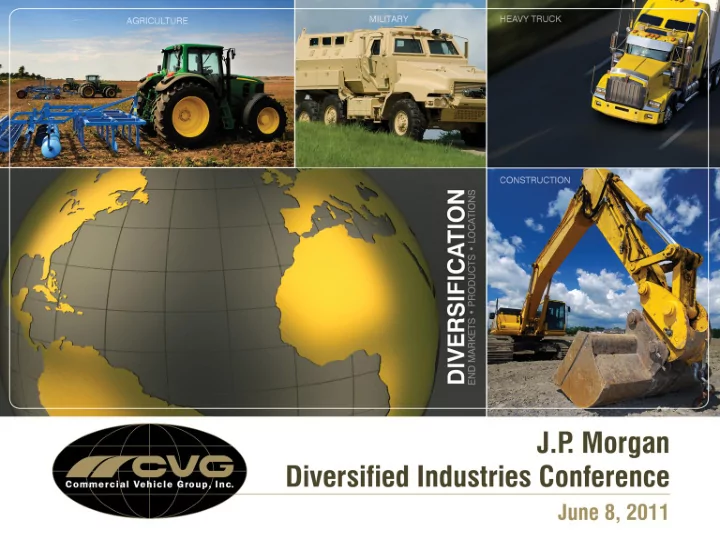
2
− Saltillo, Mexico − Beijing, China
14
Indicators Support Ongoing Recovery Significant Opportunity For Global Growth
Early stages of penetration into large Asian commercial vehicle market Growth opportunities in Asia with strong production volumes Continued growth in China Opportunity in other emerging markets (India, Russia, South America, etc.) New business wins with new and existing customers
15
(Represents cranes & movers and earthmoving equipment in thousands of units)
’09-’15 CAGR
12.3% 8.4% 6.6% 6.6% 8.0%
Heavy truck 40% Construction 23% Aftermarket 14% Military 9% Other 10% Agriculture 1% Bus 3%
Improving tone in key U.S. and European construction markets supported by strong order rates Exceptional growth in emerging markets, particularly China, Brazil, Middle East and India Significant equipment requirements to improve / replace aging infrastructure globally Broader equipment usage / recovery across end markets (e.g., industrial, oil and gas, power and mining)
Source: Millmark Associates (January 2011) Note: Revenue breakdown based on 2010 results.
* Based on Market Research – Untapped Medium / Heavy Truck Markets represent CVG’s largest opportunity for content through 1.3M vehicles in China, 384K vehicles in India and 230K vehicles in Brazil by 2015
* Based on Market Research – Construction market growth from 2010 to 2014 shows China and India as CVG’s largest opportunity to increase content along with continued focus on North American increased content and Western Europe and Japan
* Based on Market Research – Agriculture market growth from 2010 to 2014 represent CVG’s largest opportunity for content through 762K vehicles in China and 640K vehicles in India, along with continued focus on increasing North American content and growth in Brazil, Europe and Japan
19
Global Engineering Support Acoustics and Thermal Systems Development Material and Process Development Advanced Testing Services Dedicated 37,500 sq. ft. facility Design and Visualization Studio Three Secure Customer Project Bays Concept Development and Realization Physical and Rapid Prototyping Benchmarking and Reverse Engineering
Arm Rest Extended Position Advanced Seating
22
Global industry recession continued to challenged the business through 2009 with signs of recovery in 2010 and in early 2011 Continued improvement in financial results on a sequential quarter-over-quarter basis – last eight quarters Continue to drive culture of entrepreneurship, innovation and employee engagement to improve our bottom line Focus on strategic efforts during downturn:
− Diversification − Profit improvement goals across organization Actions during 2009 and 2010 demonstrate significant progress towards CVG’s long-term financial goals
23
− Reduced overall cost of debt to 7.875% − Simplified capital structure − Maintains modest leverage level, positioned to improve with cycle rebound − 3/31/2011 Pro forma available liquidity of approximately $130 million
− Significantly extends maturity profile
− Continue to monitor competitors operating in a distressed state for additional opportunities − Invest in new processes or capabilities
− Capitalize on track record integration and performance
(Prutsman / Motomirror)
1997 1998 1999 2000 2001 2002 2003 2004 2005 2006 2007 2008 2009 2010 2011
26
Adjusted EBITDA and Adjusted Operating Income
27
2005 2006 2007 2008 2009 2010 3/31/09 6/30/09 9/30/09 12/31/09 3/31/10 6/30/10 9/30/10 12/31/10 3/31/11 Operating Income 89.5 $ 97.5 $ 18.8 $ (191.4) $ (89.7) $ 16.7 $ (18.4) $ (22.2) $ (7.8) $ (41.2) $ 3.6 $ 2.6 $ 5.1 $ 5.4 $ 8.1 $ Long-lived asset impairment
30.1
1.7 1.7 0.2
0.2 0.2 0.3 Adjusted Operating Income 89.5 $ 97.5 $ 20.3 $ 16.1 $ (38.6) $ 18.4 $ (16.7) $ (11.6) $ (7.8) $ (2.6) $ 3.6 $ 4.0 $ 5.3 $ 5.5 $ 8.4 $
Source: Company filings
Fiscal Year Ending December 31 Fiscal Quarter Ending