SLIDE 11 6 12 18 24 30 36 42 48 54 60 66
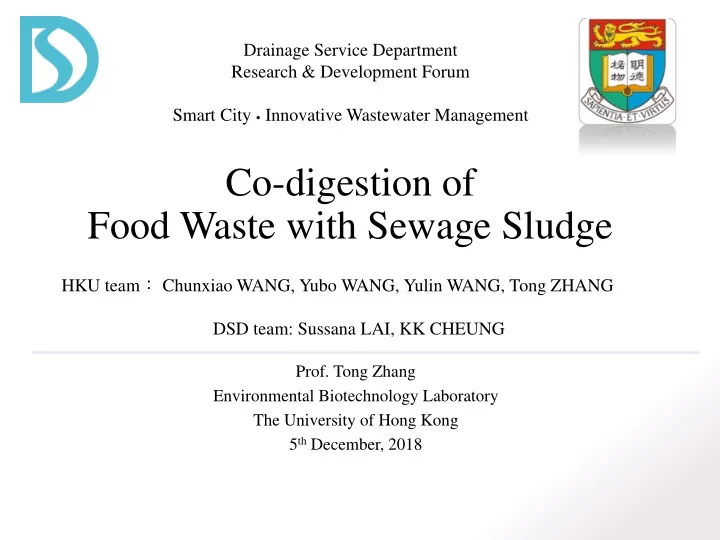
10 20 30 40 50 60 70 Methane content (%) Digestion day (d)
SRT_5d SRT_10d SRT_15d SRT_25d 6 12 18 24 30 36 42 48 54 60 66 100 200 300 400 500 600 700 800 900
methane yield (mL/gVSR) Digestion day (d)
Solid Retention Time (SRTs)
Longer SRT corresponded with higher VSR (from 32% to 47%). Methane content decreased significantly at short SRT conditions (5 d, 10 d and 15 d) and kept at a stable level during the whole fermentation process at SRT of 25 days. Methane yield decreased more quickly along with shorter SRT conditions (SRT of 5, 10 and 15 days). At SRT of 25 days, the methane yield kept stable during the whole digestion process. The highest methane yield (547 mL/g VSR) was
- btained in R4 with SRT of 25 days.
Theoretical methane yield=571 mL/g VSR
Methane content (%) Methane yield (mL/g VSR) Volatile solid reduction (%)
11
Introduction Materials and Method Results and Discussion Conclusion