
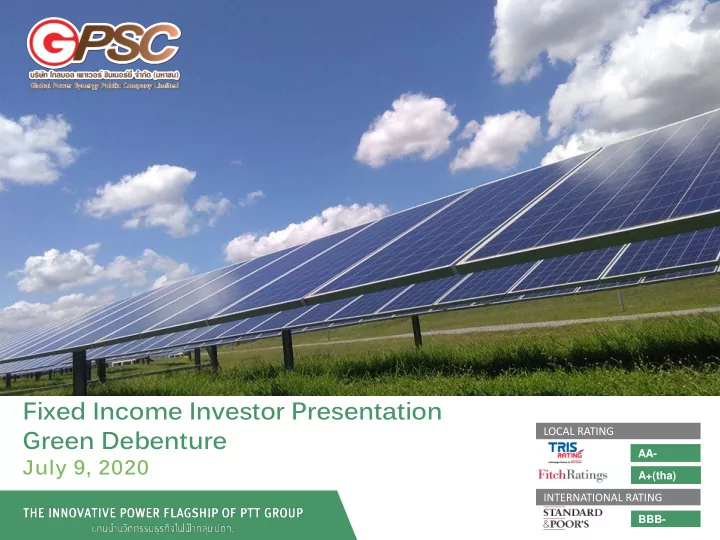
SLIDE 1
Fixed Income Investor Presentation Green Debenture
July 9, 2020
LOCAL RATING INTERNATIONAL RATING
BBB- A+(tha) AA-
Fixed Income Investor Presentation Green Debenture LOCAL RATING - - PowerPoint PPT Presentation
Fixed Income Investor Presentation Green Debenture LOCAL RATING AA- July 9, 2020 A+(tha) INTERNATIONAL RATING BBB- Disclaimer This document has been prepared by Global Power Synergy Public Company Limited (GPSC or the Company)
LOCAL RATING INTERNATIONAL RATING
BBB- A+(tha) AA-
This document has been prepared by Global Power Synergy Public Company Limited (“GPSC” or the “Company”) solely for use at a fixed income investor presentation for information purposes only. This document contains forward-looking statements based on currently held beliefs, expectation of future events and assumptions of the management of the Company as of the respective dates indicated
industry results to differ materially from those expressed or implied by such forward-looking statements. There can be no assurance that the results and events contemplated by the forward-looking statement will in fact occur or that assumptions are correct. Neither the Company nor any third-party has any obligation to update or otherwise announce any revision to forward-looking statements to reflect future events
This material does not constitute an invitation or solicitation of an offer to subscribe for or purchase any securities and neither this material nor anything contained herein shall form the basis for any contract or commitment whatsoever. This material contains general background information about the Company and its subsidiaries based on information as of the date of this material. It is information given in summary form and does not purport to be complete. It is not intended to be relied upon as advice to potential investors. Any decision to invest in any offer to subscribe for or acquire any securities of the Company must be based wholly on the information contained in the prospectus in respect of the securities issued or to be issued in connection with such offer and not on the contents hereof. This material is being communicated only to persons who have professional experience in matters relating to investments and to persons to whom it may be lawful to communicate it to (all such persons being referred to as relevant persons). This material is only directed at relevant persons and any investment or investment activity to which the material relates is only available to relevant persons or will be engaged in
such company and the nature of the securities. This document is strictly confidential and being given solely for your information and may not be shared, copied, reproduced or redistributed to any other person in any manner. In giving this material, neither the Company nor any third-party has any obligation to provide the recipient with access to any additional information or to update this material or any additional information or to correct any inaccuracies in any such information which may become apparent. None of the Company and entities named as joint lead arrangers in this material (each, a "Joint Lead Arranger") warrants the completeness or accuracy of the information contained herein, nor have they independently verified such information, and none of the Company, the Joint Lead Arrangers or their subsidiaries or affiliates, or undertakes to update or revise any information subsequent to the date hereof, whether as a result of new information, future events or otherwise. The Company and the Joint Lead Arrangers shall not have any responsibility or liability whatsoever for any loss howsoever arising from this material or its content or otherwise in connection therewith. Information concerning entities other than the Company and its subsidiaries are based on publicly available information. This material is not for distribution or redistribution in any jurisdiction. In particular, this material may not be taken or transmitted into the United States, Canada or Japan or distributed, directly or indirectly, in the United States, Canada or Japan. By participating in this material or by accepting any copy of the slides presented, you agree to be bound by the foregoing limitations. This material is not a prospectus for the offer for sale of the securities but has been prepared to publicize information regarding the securities prior to the offer for sale in order that prospective investors can have sufficient time to study the information before making any decision to invest. The information appearing in this material is the same as the information appearing in the registration statement and draft prospectus
contained in this document is subject to possible further revision. The offer of the securities may only be made when the registration statement and draft prospectus filed with the Office of the SEC have become effective and final prospectuses have been distributed to investors. Investors must study characteristics, conditions of return of the investment and risks relating to the securities before making a decision to invest in the securities. Investors are urged to read the prospectus or factsheet in respect of the securities carefully.
2
3
4
Create long-term shareholders’ value with profitable growth
Deliver reliable energy through operational excellence to customers
Conduct business with social and environmental responsibility
Seek innovation in power and utility efficiency management through energy storage technology
5
*Q1/2020 revenue by customers
LONG TERM OFF TAKE CONTRACTS
✓ Guaranteed market and source of revenue ✓ Guarantee a minimum level of profit in regards to their investment ✓ Price adjustment formula, varying with fuel price
22.8% 22.7% 20.8% 8.9% 24.8%
Public
2,819.7 million shares
SHAREHOLDING STRUCTURE TOTAL EQUITY CAPACITY *
Electricity | 5,026 MW Steam | 2,876 T/H Chilled Water | 15,400 RT Industrial Water | 7,372 Cu.m./H
COMBINED CYCLE | COGENERATION | THERMAL Electricity | 4,463 MW Steam | 2,876 T/H Chilled Water | 15,400 RT Industrial Water | 7,372 cu.m./H Electricity | 449 MW HYDROELECTRIC RENEWABLE ENERGY Electricity | 114 MW OTHER BUSINESSES 24M | BSA
COMPANY INFORMATION
Business Type | Energy & Utilities Paid-up Capital | THB 28,197 million Market Cap. | THB 211,477.5 million Listed on | Stock Exchange of Thailand
CREDIT RATINGS
BBB- AA- A+(tha)
Note: *Committed equity capacity 6
68% natural gas 16% coal 0.3% waste 2% solar 9% hydro 5% petroleum pitch
TOTAL
5,026 MW
committed equity capacity
BY FUEL TYPE
FUEL TYPE INSTALLED MW EQUITY MW total capacity in operation % total capacity in operation % natural gas 5,047 4,987 63% 3,399 3,381 68% hydro 1,502 1,502 19% 449 449 9% coal 1,045 1,045 13% 814 814 16% petroleum pitch 250
250
solar 149 109 2% 101 101 2% waste 18 9 0.2% 13 3 0.3% TOTAL 8,011 7,691 100% 5,026 4,748 100% PLANT TYPE INSTALLED MW EQUITY MW total capacity in operation % total capacity in operation % IPP 4,910 4,910 61% 2,440 2,440 49% SPP 2,614 2,554 33% 2,192 2,174 43% ERU 250
250
VSPP + renewable 237 227 3% 144 134 3% TOTAL 8,011 7,691 100% 5,026 4,748 100%
BY PLANT TYPE BY FUEL TYPE
7
TOTAL
5,026 MW
committed equity capacity
BY PLANT TYPE
49% IPP 43% SPP 5% ERU 3% VSPP + renewable
8
VSPP and renewable | 3% IPP | 49%
Sriracha Power Plant 700 29% Glow IPP 677 28% Ratchaburi Power (RPCL)* 210 9%
TOTAL 1,587 65%
GHECO-One
429 18%
Xayaburi Power (XPCL)* 321 13% Houay Ho Power 102 4%
TOTAL 423 17%
70% solar 18% hydro 9% waste 3% natural gas 65% natural gas 18% coal 17% hydro IPP TOTAL
2,439 MW
committed equity capacity
SPP | 43%
Glow Energy Phase 2 281 13% Glow Energy Phase 4 77 4% Glow Energy Phase 5 328 15% Glow SPP2 213 10% Glow SPP11 272 12% Rayong CUP 1-3 354 16% IRPC-CP (Phase 1-2) 122 6% Bangpa-in Cogeneration BIC (Phase 1-2)* 59 3% NNEG* 56 3% Rayong CUP 4 45 2%
TOTAL 1,807 82%
Glow SPP3 300 14% Glow CFB3 85 4%
TOTAL 385 18%
82% natural gas 18% coal SPP TOTAL
2,192 MW
committed equity capacity Global Renewable Power (GRP) 39.5 27% Thai Solar Renewable TSR (SSE1)* 32 22% Ichinoseki Solar Power (ISP1) 21 15% Combined Heat and Power Producing (CHPP Solar) 5 3% Glow Energy Solar PV Rooftop 2 1% Glow Energy Solar Plant 1 1%
TOTAL 100.5 70%
Nam Lik 1 Power (NL1PC)*
26 18%
Rayong WTE 10 7% Chonburi Clean Energy (CCE) 3 2%
TOTAL 13 9%
CHPP
5 3%
ERU | 5%
VSPP and renewable
TOTAL
145 MW
committed equity capacity
ERU TOTAL
250 MW
committed equity capacity
250 100%
100% petroleum pitch Note: *GPSC associates and Joint Ventures
9
Board, GPSC
Company Limited
Securities and Exchange Commission
and power of learning
Company Limited
Pailin Chuchottaworn
Corporate Governance Committee / Member of Audit Committee, GPSC
Public Company Limited
Energy
Board, Electricity Generating Authority of Thailand
Kurujit Nakornthap
the Risk Management Committee / Chairman of the Nomination and Remuneration Committee, GPSC
Governance Committee, GPSC
Executive Directors, Krungthai Bank Public Company Limited
Thai Industries
Audit Committee, GPSC
Governance Committee, GPSC
Army
Commandant, Royal Thai Army
Maj.Gen. Chaowalek Chayansupap
Member of the Corporate Governance Committee, GPSC
the Prime Minister for Administrative Affairs, Office
Minister Delivery Unit
Our directors have mix of skills and experiences to deliver sustainable growth and long-term success at GPSC
Nicha Hiranburana Thuvatham Payungsak Chartsutipol
10
Audit Committee, GPSC
Saowanee Kamolbutr
Corporate Governance Committee
Somchai Meesen
and Remuneration Committee/ Member of the Risk Management Committee, GPSC
Officer, PTT Public Company Limited
Company Limited
President, Innovation and Digital, PTT Public Company Limited
Wittawat Svasti-Xuto
Gas Business Unit, PTT Public Company Limited
Natural Gas Distribution, PTT Public Company Limited
Wuttikorn Stithit
and Remuneration Committee, GPSC
Petroleum and Gas Business Group, PTT Public Company Limited
Atikom Terbsiri
Our directors have mix of skills and experiences to deliver sustainable growth and long-term success at GPSC
11
Management Committee, GPSC
Management Committee / Chief Executive Officer and President, Thai Oil Public Company Limited
Upstream Petroleum and Gas Business Group, PTT Plc
PTT Plc
Wirat Uanarumit Bandhit Thamprajamchit
Corporate Governance Committee
President-Refinery and Petrochemical and also taking a position of Executive Vice President-Operation Excellence (Act.), Thai Oil Public Company Limited
Management Committee, GPSC
reporting to Chief Operating Officer, Downstream Petroleum Business Group, PTT Public Company Limited
Management Committee and Chief Executive Officer, PTT Global Chemical Public Company Limited
Kongkrapan Intarajang Boonchai Chunhawiksit
Member of the Risk Management Committee / President and Chief Executive Officer, GPSC
PTT Public Company Limited
Chawalit Tippawanich
Vice President, Upstream Petrochemical Business PTT Global Chemical Public Company Limited
Our directors have mix of skills and experiences to deliver sustainable growth and long-term success at GPSC
12
Proven Track Record and Expertise in Thai Energy and utilities Industry
Rosaya Teinwan Sirimet Leepagorn Wanida Boonpiraks Chawalit Tippawanich President & CEO
EVP
Corporate Strategy and Subsidiary Management
EVP
Business Development 28 years in PTT Group Energy & utilities industry 29 years in PTT Group Energy & utilities industry 32 years in PTT Group Energy & utilities industry 14 years in PTT Group 16 years in Energy & utilities industry
▪ Several senior executives have long experience working within the PTT Group and have expertise in power generating business ▪ Rotation policy of key staff within the PTT Group helps foster closer linkage with key shareholders in the company ▪ Succession planning encourage talented employees and to ensure continuity of strategies ▪ PTT Group regular meetings drive synergies between the key subsidiaries of the Group
Pajongwit Pongsivapai
COO
28 years in Energy & utilities industry
CFO
13
GPSC was founded in 2013 to be “the Power Flagship of PTT Group”. Since its inception, GPSC has proved its strong expertise in
1997
Independent Power (Thailand) was established (700 MW, IPP) (Renamed to ” Sriracha Power Plant”)
2004
PTT Utility was established (339 MW, SPP) (Renamed to “Rayong Power Plant “)
2013
All PTT’s power assets were consolidated under GPSC
56% 24% 20% 60% 40%
2014 2015
8 of PTT’s power assets were transferred to GPSC GPSC was Listed on the Stock Exchange of Thailand (SET)
2016
Included in the Asia Pacific ex Japan FTSE, ESG 100, and SET50 Index
2018
GPSC entered into a share purchase transaction and tender offering of all the remaining securities of Glow Energy Public Company Limited (GLOW)
2019
GPSC holds 99.83% of GLOW’s shares and GLOW securities has been delisted from the SET on 13th Dec GPSC has completed the Equity Offering
issuance of THB 35,000 million. GPSC announced the capital increase from the existing capital of THB 14,983 million to THB 28,197 million As of 2019, GPSC’s current electricity generating according to Equity MW is 5,026 MW of electricity
2020
Repaid all bridging loans New organization structure implemented since 1 Apr 2020
14
equity capacity
equity capacity
equity capacity 2020 2021 2022 - 2023 INORGANIC GROWTH
GR P | +39.5 MW
PROJECT COD
Expansion | +18 MW S emi -solid Battery Pilot plan t | 30 MW h
PROJECT COD
Ray ong W TE | +10 MW
2020 – 2025 Target PROJECT COD
SPP Replacement (Stage 1)3 ERU | +250 MW
SELECTIVE GROWTH
✓ Go along with PTT Group ✓ Conventional Energy (TH and International) ✓ Renewable Energy (solar and wind) ✓ Battery Business
Notes: 1. Consisting of operating projects 4,708 MW (COD before 2020), GRP 39.5 MW and NNEG Expansion 18 MW)
electricity and 300 T/h steam, SCOD in 2022; and SPP Replacement Stage 2: Glow SPP2 and Glow SPP3 is under feasibility study for internal investment approval.
15
SYNERGY & INTEGRATION SELECTIVE GROWTH S-CURVE
Synergy Capture Operation Excellence & Asset Optimization Corporate & Business Infrastructure Go along with PTT Group Domestic and International Renewable Battery Business Energy Storage System Integrator Energy Management Solution Provider
Operation Excellence & Asset Optimization Corporate & Business Infrastructure
SYNERGY & INTEGRATION
SYNERGY AND INTEGRATION IMPLEMENTATION “working as one team to deliver synergy”
RECURRING SYNERGY VALUE BASED ON CURRENT PORTFOLIO 89% 8% 3%
Operations & Maintenance Procurement
& IT Ramp up with full synergy value contribution by 2024
THB - 4.0 bn
One-time initial investment
2020 ENDORSED SELECTED INITIATIVES TO LOCK-IN VALUE
As of Q1/2020, GPSC was able to recognize the synergy value of approx. THB 121 mm from:
management
2020 FOCUS MOVED FROM INDENTIFYING POTENTIAL TO DELEVERING PROMISES ✓ Execution Focus | Move to monitoring and controlling ✓ Speed of Delivery | Prioritization and planning ✓ Enablement & Ownership Transfer
16
89% 11%
Commited Capacity 2020-2023
5,026 MW
equity capacity
“Continuously seeking more international growth opportunities”
✓ To be listed in DJSI by 2022 ✓ Increasing renewable energy up to 30% of GPSC’s installed capacity
Note: *Renewable energy includes solar, wind, waste, hydro, etc.
70% 30%
Long-Term Target Way forward to sustainable growth
SUSTAINABILITY STRATEGY & COMMITMENT
Conventional Energy Renewable Energy*
17
Go along with PTT Group Domestic and international Renewable SELECTIVE GROWTH “Focus Countries : Thailand, Myanmar Vietnam and Taiwan
First Battery Cell by End of 2020
BATTERY MANUFACTURE
18
19
20
▪ Sustainability is embedded in GPSC Strategic Direction and Growth Strategy, 3S Strategy | Selective Growth ✓ To be listed in DJSI by 2022 ✓ Increasing renewable energy up to 30% of GPSC’s installed capacity
70% 30%
Long-Term Target Conventional Energy Renewable Energy*
▪ GPSC has operated in line with its commitment to innovation development alongside social and environmental responsibilities, as sustainability business strategy, called “Innovative & sustainable power for all”, by employing the sustainability management framework and 3D Principles. GPSC’s commitment to the Sustainable Development Goals (SDGs) ▪ GPSC has embraced six main goals of the UN’s Sustainable Development Goals as guidelines for the company’s sustainable development management and for the benefit
21
Enhance stability of access by investing in Solar Rooftop and Solar floating Empower for a better living by providing occupational training program, light for a better life program and zero-waste village Eco-system of driving clean energy, cultivating the circular economy concept, and easing environmental impacts Sustainable Innovation for the corporation to drive improvement initiatives through Artificial Intelligence (AI) and Blockchain, innovation culture and young social innovator
Sustainability Management Framework
22
Decentralize
Decentralization refers to the decentralization of electricity from large power stations to small scale ones by harnessing renewable energy such as solar power from solar rooftops integrates into microgrid and smart grid
software and batteries. GPSC recognizes the importance of batteries in enabling exceptional energy storage to expand the possibilities for our
Technologies, Inc. in establishing a lithium ion battery factory for business expansion.
Decarbonize
GPSC is committed to reducing pollution and using green products to reduce the impacts on the environment. The use of renewable energy is, therefore, pivotal in the company’s operation. We are determined to develop batteries as renewable energy, embracing the future trend that gears towards renewable energy storage. Decarbonization is also in line with the ecological goals of Thailand’s national integrated energy plan in terms of increasing power production from renewable energy and using advanced technologies to minimize impacts on the environment and communities.
Digitalize
GPSC uses digital technologies to increase work efficiency. Digital technologies enable us to cut unnecessary processes, reduce costs, transform businesses to technological societies and gain advantages in business competitiveness in this rapidly evolving world.
23
Climate Change Governance Structure
GPSC recognizes the risk and potential impacts from climate change and global warming and is committed to provide
full support and collaborating enthusiastically with every sector to achieve the challenging goal
reducing greenhouse gas emissions by adopting a robust climate change policy and management approach. Climate change management at GPSC is under the supervision of the executive team led by the Chief Executive Officer and with the CEO serving as president.
24
The company’s performance in 2019 towards sustainable development across economic, social and environmental dimensions has allowed it to win the confidence and affirmations from various organizations, both domestically and internationally.
Sustainability Disclosure Award 2019 By: Thaipat Institute Rising Star Sustainability Awards 2019 By: The Stock Exchange of Thailand Thailand Sustainability Investment 2019 By: The Stock Exchange of Thailand Thailand Voluntary Emission Reduction Program:
By: Thailand Greenhouse Gas Management Organization (Public Organization) Platinum Award Winners from The Asset ESG Corporate Awards 2019 By: The Asset Low-carbon Industrial Factory By: Thailand Greenhouse Gas Management Organization (Public Organization) Certification of Green Meetings for the Year 2019 By: Thailand Business Council for Sustainable Asia Responsible Enterprise Award 2019 (in the Category of Green Leadership Award) By: Enterprise Asia
25
Evaluation and Selection
Proceeds
External Reviewer
(“ICMA”) Green Bond Principles (“GBP”) 20181;
(“ACMF”) ASEAN Green Bond Standards (“ASEAN GBS”) 20182;
Principles (“GLP”) 20203.
Remark
1 https://www.icmagroup.org/green-social-and-sustainability-bonds/green-bond-principles-gbp/ 2 https://www.theacmf.org/initiatives/sustainable-finance/asean-green-bond-standards 3 https://www.lsta.org/content/green-loan-principles/
DNV GL is the provider
Second Party Opinion of GPSC’s Green Finance Framework
alignment with GBP, ASEAN GBS, and GLP.
26
International Capital Market Association (“ICMA”) Green Bond Principles (“GBP”) 2018 The ASEAN Capital Markets Forum (“ACMF”) ASEAN Green Bond Standards (“ASEAN GBS”) 2018 LMA / APLMA’s Green Loan Principles (“GLP”) 2020 Principles/ Standards
Core Components of Principles Underlying Instrument Remark of difference from GBP
1) Use of Proceeds 2) Process for Project Evaluation and Selection 3) Management of Proceeds 4) Reporting Green Bonds 1) Use of Proceeds 2) Process for Project Evaluation and Selection 3) Management of Proceeds 4) Reporting Green Bonds
a geographical or economic connection to the region
from the ASEAN GBS
be given access to information continuously
periodic reporting which would increase transparency
have the relevant expertise and experience in the area which they are reviewing.
1) Use of Proceeds 2) Process for Project Evaluation and Selection 3) Management of Proceeds 4) Reporting Green Loans
Application to Revolving Credit Facilities:
A revolver may include a specific green tranche but, where not possible, a borrower may seek to report to the lenders the use of any revolver borrowing and/or identify green assets supported by the revolving credit facility.
Issuer
Association (“ICMA”)
Markets Forum (“ACMF”)
(“LMA”),
Association, (“APLMA”)
Trading Association (“LSTA”) With support of
Association (“ICMA”)
27
Use of Proceeds Process for Project Evaluation and Selection Management
Reporting External Review
GPSC will allocate an amount at least equivalent to the net proceeds of the Green Bonds/loans financing instruments issued under this Framework towards financing or refinancing, in whole or in part, new and/or existing eligible projects of GPSC and its affiliates as described below (“Eligible Green Projects”) in the eligible categories, together forming the “Eligible Green Project Portfolio”. Renewable Energy
acquisition, conception, construction, development and installation as well of re-powering of renewable energy production
dedicated to renewable energy technology
projects
25MW is excluded
Category (GBP) Criteria Eligible Green Project Exclusion Energy Efficiency
and maintenance of Energy Storage Facilities
projects that would reduce energy consumption, improve network/energy efficiency and/or reduce electricity grid losses
comprising combined heat and power (CHP)
waste and excess heat utilization
conception, construction, development and/or operation of electricity storage facilities, aiming at power grid stabilisation and/or management of peak generation of renewable energy
Pollution Prevention and Control
biomass and waste products
management, circular economy, pollution prevention
material recovery
materials
/ biogas from waste
Solar Projects 3,305 66% WTE Project 1,695 34%
28
Use of Proceeds Process for Project Evaluation and Selection Management
Reporting External Review
TYPE ELECTRICITY (MW) CUSTOMERS GPSC’s HOLDING
(through GRP)
Solar Power Plant
Provincial Electricity Authority (PEA)
SOLAR PROJECTS ACQUISITION (GRP)
RDF (T/day) LOCATION CUSTOMERS PROJECT UPDATE
under GPSC
Rayong, Thailand
SCOD | Q2/2021
Waste
The RDF Project construction been starting to sort waste to produce RDF energy since 2018
Provincial Electricity Authority (PEA)
TYPE ELECTRICITY (MW) GPSC’s HOLDING
Q1/2020 progress
57.5%
WASTE TO ENERGY PROJECT PROJECT CLOSING | 26 MAR 2020 SOLAR PROJECT (CHPP)
TYPE
Solar Power Plant/ Private PPA
GPSC’s HOLDING
/1 /1 YTD Actual cost
29
Use of Proceeds Process for Project Evaluation and Selection Management
Reporting External Review
Green Finance Working Group
Funding and Treasury Management Business Development Transformation and Sustainability Management The Plant Safety, Health and Environment Division Business Units (Case by Case basis)
Responsibilities of Green Finance Working Group
ensure eligibility for green financing
Management Committee to review and approve
ensure the eligibility of projects, whilst replacing any ineligible projects with new green assets
policy and internal environmental and social standards
Management Committee Green Finance Working Group
30
Use of Proceeds Process for Project Evaluation and Selection Management
Reporting External Review
GPSC will attempt to maintain an Eligible Green Project Portfolio that at least matches or exceeds the net proceeds from its outstanding Bonds issued under this Framework.
The net proceeds from GPSC’s Green financing instruments will be deposited in the general account and an amount equal to the net proceeds will be earmarked for allocation to the Eligible Green Projects in accordance with GPSC’s Green Finance Framework.
During the life of the instruments issued under this Framework if a project ceases to fulfil the eligibility criteria, GPSC will remove the same from the portfolio upon becoming aware and replace it with another eligible green project as soon as reasonably practicable.
GPSC will track the use of net proceeds of instruments issued under this Framework via its internal information system. The balance of the tracked proceeds should be adjusted on an annual basis, in order to match the allocation to Eligible Green Projects re/financed during this period.
For any net proceeds of instruments issued under this Framework that remain unallocated, GPSC will hold the proceeds in cash and/or invest in other short-term liquid instruments, in line with GPSC’s policy. GPSC will aim to be fully allocated to Green Projects within 2 years of Issue date.
31
Use of Proceeds Process for Project Evaluation and Selection Management
Reporting External Review
Reporting Frequency: annually, until full allocation
percentage of allocation to the Eligible Green Project Portfolio
financed
allocated by Project Category
used for financing vs. refinancing
proceeds On an annual basis, GPSC intends to report on the impact
environmental perspective, subject to the availability
information and baseline data and based on methodologies that will be publicly available. Reporting Frequency: annually Available on GPSC website
32
Use of Proceeds Process for Project Evaluation and Selection Management
Reporting External Review
Renewable Energy Energy Efficiency Pollution Prevention and Control
generation comprising combined heat and power (CHP)
the project in % of total waste and/or in absolute amount in tonnes p.a
energy/ emission-efficient waste to energy facilities in MWh/GWh (electricity)
tCO2e p.a.
Eligible Green Project Categories Sub-categories Examples of impact indicators
Reporting Frequency: annually
Available on GPSC website
33
Use of Proceeds Process for Project Evaluation and Selection Management
Reporting External Review
GPSC has engaged DNV GL to provide the Second-Party Opinion (“SPO”)
The Second-Party Opinion ensures the Framework is aligned with global benchmarks as defined by the Green Bond Principles 2018, ASEAN Green Bond Standards 2018, Green Loan Principles 2020, and market best practices.
“On the basis of the information provided by GPSC and the work undertaken, it is DNV GL’s opinion that the BOND meets the criteria established in the Protocol and that it is aligned with the stated definition of green bonds within the Green Bond Principles 2018. Based on the limited assurance procedures conducted, nothing has come to our attention that causes us to believe that the GPSC Green Bond is not, in all material respects, in accordance with the ASEAN Green Bond Standards 2018.”
In order to provide transparent information about the reporting of the funds from bonds issued under this framework, GPSC intends to engage a Second Party Opinion Provider/ Verifier/ External Auditor to provide the assessment
the alignment
the allocation
funds with Framework’s criteria until the full allocation of the proceeds.
34
PROFIT
107% Increase in Adjusted Net Income, YoY due to full contribution from Glow and higher AP from Sriracha Power Plant due to THB depreciation against USD 27% QoQ increase from Q4/2019 due to increased AP and EP from EGAT and decreased cost of SPP natural gas and maintenance No Significant COVID-19 Impact Q1/2020 started off with strong
However, any delayed impact on industrial customers demand being closely monitored
CONTROL
Projects Under Construction Expansion phase, 92.3% construction progress, SCOD in 2020 WTE, 57.5% construction progress, SCOD in 2021 ERU, jointly operated with Thaioil, 29% construction progress, SCOD in 2023 SPP Replacement, replacement
▪ GE Phase 2 (Stage 1): under
construction with SCOD in 2022
▪ GSPP2 and GSPP3 (Stage 2):
under feasibility study for internal investment approval
SIGNIFICANT GROWTH
Integration & move forward with the new organizational GLOW acquisition completed and new organization structure implemented since 1 Apr 2020 to ensure synergy target and group’s vision are supported Bridging Loan Fully Repaid GPSC’s bridging loan of THB 134.5 billion fully repaid in Q1/2020 as planned by capital increase of THB 74 billion and debenture issuance of THB 35 billion completed in Q4/2019 and new bank loans of THB 12 billion obtained in Q1/2020 Closing of 39.5 MW Solar Project Completed M&A of 39.5 MW solar project through GRP on 26 Mar 2020
SUSTAINABILITY
2nd Interim Dividend
2019 2nd interim dividend payment of THB 0.80 per share made on 17 Apr 2020
Awards
Best Cross-Border M&A deal from the THB 134.6 billion acquisition deal of Glow Energy PLC from Engie Development BV 2019 Bond Deal of the Year from the issuance
35
36
IMPACT ON GPSC BALANCE SHEET | THB million Balance Sheet Component As of 31 Dec 2019 Impact As of 1 Jan 2020 TAS 32 and TFRS 9 TFRS 16 Total impact Asset 252,017 (548) 2,233 1,685 253,510 Liability 141,841 1,312 2,514 3,826 145,475 Equity 110,176 (1,860) (281) (2,141) 108,035 New Thai Financial Reporting Standards (TFRS) implemented in 2020 with significant impact are:
NEW ACCOUNTING STANDARDS IMPLEMENTED IN 2020
4,868 6,356 18,662 2,477 4,599 5,365 2017 2018 2019 Q1/19 Q4/19 Q1/20 3,175 3,359 4,061 942 1,145 1,580 384 368 2017 2018 2019 Q1/19 Q4/19 Q1/20
Note: 1) Gross Profit Margin = Gross Profit / Revenue 2) EBITDA Margin = EBITDA / Revenue 3) Net Profit Margin = Net Profit / Revenue
Revenue (THB million) EBITDA and EBITDA Margin (THB million,%)
EBITDA Margin Net Profit Margin Adjusted Net Income PPA Amortization
Net Profit
Gross Profit and Gross Profit Margin (%) Net Profit and Net Profit Margin (THB million,%)
Gross Profit Margin
19,917 24,777 66,562 9,067 18,279 18,308 2017 2018 2019 Q1/19 Q4/19 Q1/20 4,187 5,457 16,783 2,112 4,116 4,951 2017 2018 2019 Q1/19 Q4/19 Q1/20 21% 22% 25% 23% 23% 27% 1,529 1,948 16% 14% 6% 10% 8% 11% 27% 25% 29% 24% 26% 28% 37
40,374 42,349 110,176 106,739 689 911 25,736 30,022 10,815 12,509 29,215 45,189 4,993 4,995 52,707 52,673 3,097 3,675 34,182 14,727
59,968 64,439
5,752 6,108 90,346 93,072 5,959 5,354 8,685 8,661 27,246 28,535 101,272 102,763 11,698 12,979 13,901 12,471 9,313 11,463 37,813 32,383
252,017
38
Total Liabilities & Shareholders Equity (THB million) Total Assets (THB million)
Equity Other non- current liabilities Long-term borrowing Debentures Current liabilities 6% 13% 59,968 31 Mar 20 31 Dec 19 31 Dec 18 31 Dec 17
Larger and Stronger Power House
64,439 249,350 5% 41% 4% 37% Current Assets Investments in associates Property, plant and equipment Finance lease and receivable Other non- current assets 31 Mar 20 31 Dec 19 31 Dec 18 31 Dec 17 21% 18% 12% 43% 252,017 249,350
39
Net Debt/ Equity ratio (Times)
Note: The ratio calculation follows the definition in Terms and Conditions of the Bonds
0.29 0.27 0.74 0.84
2017 2018 2019 Q1/20*
40
Net Debt to Equity ≤ 1.0x Net Debt to EBITDA ≤ 4.0x Dividend Policy: Minimum dividend at the rate of not less than 30 percent of the net profit according to the
financial statements of the Company after the deduction of tax, reserved funds as required by law (with additional conditions)
41
AA- (Stable)
The 3 leading local and international Rating Agencies have affirmed rating post the acquisition of GLOW
A+(tha) / (Stable) BBB- (Stable)
LOCAL RATING INTERNATIONAL RATING
Strengthened Linkage with PTT
GPSC is a major supplier of electricity and steam to PTT's key petrochemical and refinery (P&R) subsidiaries, including PTTGC and IRPC.
One of the largest Private Producer in Thailand
GPSC’s power portfolio, in proportion to its ownership or equity capacity, stood at 5,026 MW.
Well-diversified Power Portfolio
As of 1H19, GPSC owned 29 power plants in Thailand and abroad.
Predictable Cash Flow Backed by Long-Term PPAs
Solid cash flow supported by long-term contract with EGAT and reputable industrial users under the PTT Group.
Long-Term Contracted Revenues
GPSC's revenue visibility to remain strong post-acquisition, as most of GLOW's generating assets are part of Thailand's regulated electricity business.
Asset Diversity Enhances Business Profile
The acquisition of GLOW and the investment in ERU will improve GPSC's business profile, with its increased size driving better asset and geographical diversification.
Improving Margin; Stable Cash Flow:
GPSC will benefit from the cheaper fuel cost of GLOW's power plants, particularly the coal-fired power plants. Fitch expects GSPC to generate cash flow from operations of around THB14 billion-15 billion a year over the next 3 years.
Strong Support from PTT Group GPSC is expected to receive extraordinary
support from PTT group if needed.
Steady Operating Performance with Improved Margin
The combined entity's margin profile will improve with greater coal exposure and Glow's higher-margin contracts for small power producers (SPP).
Strong Support from PTT Group
PTT Group to continue providing support to GPSC as the flagship company in the power business under the group
42
staff team in cogeneration power plant and PTT Group
along with PTT Group
types and location
feedstock agreement
synergies
financial flexibility
43
Economic Outlook
Key assumptions
Performance outlook
be affected in the future. The company expect the utilization rate in 2020 at 95 - 100%
recognized the accumulated historical transactions to the retained earnings and recognize the current revalued transactions to the Statement of Income at the end of the accounting period, subsequently.
44
45
The Innovative Power Flagship of PTT Group with Equity Capacity of 4,748 MW and Committed Equity Capacity of 5,026 MW Strong company ratings from both TRIS and FITCH at AA- and A+(tha) respectively Well-Versed Board Members and Highly Experienced Management team with Proven Track Record and Expertise in Thai Energy and Utilities Industry Reliable Cash Flow with Solid Customer Profile including EGAT and long- established Industrial Users Base under Secured Long-Term Agreements (Power, Steam, Industrial Water) Thailand’s Top rank SPP Player with Operational Synergies and Cost Reduction from the Acquisition of GLOW Diverse Business Portfolio and Geography The First Green Bond including WTE project
46
47
Issuer Global Power Synergy Public Company Limited (“GPSC”) Joint Lead Underwriters Bangkok Bank Public Company Limited (“BBL”) Bank of Ayudhya Public Company Limited (“Krungsri”) Standard Chartered Bank (Thai) Public Company Limited (“SCBT”) Debenture Type Thai Baht Senior and Unsecured Green Debentures with Debentureholders’ representative Offering Type Private Placement to Institutional and High-Net-Worth Investors (PP-II&HNW) Company Rating AA- with Stable outlook by TRIS Ratings Co., Ltd. A+(tha) with Stable outlook by FITCH Ratings (Thailand) Co., Ltd. Issue Rating [AA-] by TRIS Ratings Co., Ltd. Total Issue Size Up to THB [] million Tenor 5-year 10-year 15-year Coupon Payment Payable Semi-Annually Debentureholders’ Representative Bank of Ayudhya Public Company Limited Registrar and Paying Agent Bank of Ayudhya Public Company Limited Principal Repayment At Par Value, Bullet at the Maturity Date Registration Thai Bond Market Association (ThaiBMA) Second Party Opinion Provider DNV GL
48
9 July 2020
[30 July 2020]
[4-6 August 2020]
[7 August 2020]
IR Contact: Pongsak Plaingam +662 140 4646 Viriya Tassanabhakorn +662 140 5358 Suthathip Charoenkij +662 140 5318 Parima Phadungsit +662 140 4691 ir@gpscgroup.com www.gpscgroup.com
Q&A SESSION
Business Area Company PTT’s Holding (%) Activities
E&P PTTEP 65.29%
Exploration and production
Coal PTT Global Management 100%
Coal business
LNG PTT Global LNG PTT LNG 50% 100%
LNG value chain LNG receiving terminal
Gas Gas Pipeline* 100%
Sole owner/operation of the transmission pipeline
S&M* 100%
Supply & marketing of natural gas
GSP* 100%
Extracting hydrocarbon contents in natural gas for petrochemical’s feedstock
Trading Trading* 100%
Import/Export/Out-out trading of petroleum and petrochemical products
Oil Marketing PTTOR** 100%
Retail service stations and commercial marketing
Petrochemical & Refining PTTGC TOP IRPC 48.18% 48.03% 48.05%
Petrochemical flagship Refinery flagship Integrated refinery & petrochemical
Power 22.81%
Power flagship New S-Curve business of PTT group
Note: *Businesses directly operated by PTT PLC **Transferred asset to PTTOR on July 1, 2018 Source: PTT’s Investor Update May 2019
Upstream
Intermediate Downstream Technology & Engineering
51
52
EGAT (39%) IPPs (36%) SPPs (16%) Imports (9%) VSPPs (<1%) EGAT (Single Buyer, Network System Operator) (99%) Generation Transmission MEA (30%) End User (99%) Distribution Industrial User (1%) PEA (69%)
ERC (Regulator)
Cogeneration Plant Peak demand 37,312 MW in 2019 End Users
and PEA
Definition EGAT Electricity Generating Authority of Thailand (State-owned entity) IPP Independent Power Producers SPP Small Power Producers VSPP Very Small Power Producers MEA Metropolitan Electricity Authority (State-owned entity) PEA Provincial Electricity Authority (State-owned entity) ERC Energy Regulatory Commission
Source: EGAT and GPSC
53
* Under various type of contracts. ** Fuel Saving (FS) *** Reference rate with conditions: https://www.pea.co.th/Documents/Rate2015.pdf
IPP SPP VSPP
Independent Power Producer (IPP):
who has entered into the Power Purchase Agreement (PPA) with contracted capacity more than 90 MW
their entire output to EGAT Very Small Power Producer (VSPP):
power generating process is generated from renewable energy, cogeneration, biogas, biomass, waste heat, etc. with contracted capacity no more than 10 MW of electricity capacity
Distribution Utility Authority only Availability % x Availability Payment Rate (APR) Energy cost regarding % Dispatch to EGAT
Availability Payment Fuel Payment Base Tariff Ft
PEA tariff TOU Rate 4.2**
EGAT (Power)
Firm
Capacity Payment Energy Payment
Non-Firm
Industrial Customers
K factor
(seasonal weight)
Energy Payment
Electricity Steam
Steam Base Cost x (Gas index + CPI index)
adder Feed in Tariff
Small Power Producer (SPP) / Cogeneration (Cogen):
electricity to EGAT* and sell their electricity and utilities (e.g. steam, industrial water, chilled water) to Industrial customers (IUs) Contract Type: EGAT:
IUs: Commercial contract as agreed.
Capacity
(MW)
18 (6*3) 17.9 (5.96*3) 3.6 (1.2*3) Service Company Off-taker PEA PEA PEA Tariff Scheme FiT at 5.66 THB/kWh FiT at 5.66 THB/kWh Adder at 8 THB/kWh COD Dec 2015 Dec 2015 Mar 2014/Mar 2015 Location Pichit, Suphanburi and Lopburi Pichit Khon Kaen
M&A project
N.P .S Star Group World X Change Asia P .P . Solar Global Renewable Power Operating
54
TYPE ELECTRICITY (MW) CUSTOMERS GPSC’s HOLDING
(through GRP)
Solar Power Plants
Provincial Electricity Authority (PEA)
PROJECT CLOSING | 26 MAR 2020
55
Project under construction
TYPE ELECTRICITY (MW)
RDF (T/day) LOCATION CUSTOMERS PROJECT UPDATE
under GPSC
Rayong, Thailand
SCOD | Q2/2021
Q1/2020 progress
57.5%
Waste
starting to sort waste to produce RDF energy since 2018
progress is 57.5% and on schedule
Provincial Electricity Authority (PEA)
56
Project under construction
GPSC’s HOLDING PROJECT UPDATE
Map Ta Phut Industrial Estate Rayong, Thailand
SCOD | Q4/2022
July 2020
1 August 2020
Gas-fired Cogeneration
EGAT
(SPP Firm, 2*30 MW, 25-yr) Industrial Users
TYPE ELECTRICITY (MW) STEAM (T/h) LOCATION CUSTOMERS
ERU Project is a thermal power plant project that produces electricity and steam by using petroleum pitch which is a result of the refinery of Clean Fuel Project (CFP) of Thaioil. The electricity and steam produced are sent back to the CFP at the Thai Oil Refinery.
57
Project under construction
TYPE ELECTRICITY (MW)
STEAM (T/h) LOCATION CUSTOMERS GPSC’s HOLDING PROJECT UPDATE
ERU co. Thai Oil Refinery, Sriracha, Chonburi, Thailand
SCOD | 2023
Design, Process Review, 3D Model Review
Equipment Foundation
equipment: purchase, manufacturing plan, PIM can proceed according to plan
Petroleum Pitch
BY PRODUCTS | Sulfuric acid, condensate water
Thai Oil Public Company Limited
(25-year, 200 MW of electricity and 175 T/h of steam)
Q1/2020 progress
29.0%
PROJECT TIMELINE & MILESTONE PAYMENTS
ERU Approval (1-Apr-19)
P R O J E C T C O N S T R U C T I O N P E R I O D
2019 2020 2021 2022 2023
80%
2% 8% 4% 6%
Final Purchase Price < USD 757 mm Initial Payment 20%
SCOD 2023
MILESTONE PAYMENTS
58
Revenue breakdown | by sector Key monitoring
stopped operation and no overtime
*Based on power and steam sales which included GLOW from 1 Jan - 31 Dec 2019 for illustration only
Petrochemical & Refinery 76% Chemicals 17% Industrial GAS 3% Steel 1% Automotive 2% Others 1%
GPSC recognizes and gives priority to the safety of all employees and strives for generating electricity and utilities to continuously meet the customers’ requirement GPSC established G-COVID Monitoring and Surveillance Center of GPSC Group to monitoring the situation, defining plans and preventive measures, as well as providing and supporting necessary supplies
Monitor internal and external situations with PTT Group Specifying measures and making plans to prevent the outbreak Performance report to the management Procure and support necessary resources Establish a GPSC Group Communication Center
59
all employees
temperature checks at the entrance
equipment
non-workplaces areas
“Golden Man” and manpower management
“safe houses” for Golden Man and necessary staffs
production process areas and control rooms
an employee infected with COVID-19 virus
in case of Safe Shutdown
Plant Operation Standing Order
60
61
มาตรการภาครัฐและเอกชนอื่นๆ
✓ Setup PTT Group’s Business Continuity Plan ✓ 3Rs: Reduce, Reuse, Recycle ✓ Increase operation efficiency and cooling water cycle ✓ Use clarified water from waste water treatment process ✓ Additional initiatives MITIGATION PLAN
Sea Water RO
@Rayong : water production will be ready in May-2020
Mobile RO
Waste Water Recycling @Sriracha : Ready to use
ที่มา: บริษัท จัดการและพัฒนาทรัพยากรน ้าภาคตะวันออก จ ากัด (มหาชน) (EW), ส านักงานคณะกรรมการนโยบายเขตพัฒนาพิเศษภาคตะวันออก (สกพอ. หรือ EECO)
ภาครัฐ-เอกชน ผนึกก าลังสร้างความมั่นใจ
ผันน ้าจากเครือข่ายและอ่างเก็บน ้าต่าง ๆ ใน พื้นที่ใกล้เคียงเป็นไปอย่างมีประสิทิิภาพ
ตะวันออกต่างในความร่วมมือกับภาครัฐ ในการประหยัดน ้าลง 10% และยังคงด าเนิน มาตรการต่อไปจนกว่าสถานการณ์จะคลี่คลาย “Closely monitor the drought situation and various plans are being prepared”
62
ิ.ค.-2561 ม.ค.-2562 ก.พ.-2562 มี.ค.-2562 เม.ย.-2562 พ.ค.-2562 มิ.ย.-2562 ก.ค.-2562 ส.ค.-2562 ก.ย.-2562 ต.ค.-2562 พ.ย.-2562 ิ.ค.-2562 ม.ค.-2563 ก.พ.-2563 มี.ค.-2563 เม.ย.-2563 พ.ค.-2563 มิ.ย.-2563 ก.ค.-2563 ส.ค.-2563 ก.ย.-2563 ต.ค.-2563 พ.ย.-2563 ิ.ค.-2563
ที่มา: บริษัท จัดการและพัฒนาทรัพยากรน ้าภาคตะวันออก จ ากัด (มหาชน) (EW),
63 Name Type Total capacity (MW) Equity Power capacity (MW) Equity Operating Power capacity (MW) Steam (T/H) Industrial water (Cu.m/H) Direct shareholding (%) COD Tenor IN OPERATION IPP Huay Ho IPP 152 102 102
1999 30 Sriracha IPP 700 700 700
GPSC (100%) 2000 25/2025 Glow IPP IPP 713 677 677
2003 25 RPCL IPP 1,400 210 210
2008 25/2033 GHECO-One IPP 660 429 429
2012 25 XPCL IPP 1,285 321 321
2019 29/2048 Total IPP 4,910 2,439 2,439
SPP Glow Energy Phase 1 SPP
1,340 GLOW (100%) 1994
SPP 281 281 281 300 1,180 GLOW (100%) 1996 3 Glow Energy Phase 4 SPP 77 77 77 137 2,050 GLOW (100%) 2005 25 Glow Energy Phase 5 SPP 328 328 328 160
2011
SPP 513 513 513 190 150 GLOW (100%) 1999 25 Glow SPP 11 Phase 1 SPP 120 120 120
GLOW (100%) 2000 25 Glow SPP 11 Phase 3 SPP 42 42 42
2006
SPP 110 110 110
GLOW (100%) 2012 25 Glow Energy CFB 3 SPP 85 85 85 79
2010
SPP 226 226 226 890 720 GPSC (100%) 2006 10-15/2021++ CUP-2 SPP 113 113 113 170 510 GPSC (100%) 2008 15/2022++ CUP-3 SPP
770 GPSC (100%) 2009 15/2023++ BIC-1 SPP 117 29.25 29.25 5
2013 25/2038 BIC-2 SPP 117 29.25 29.25 5
2017 25/2042 IRPC-CP Phase 1 SPP 45 23 23 86.7
2015 25/2040 IRPC-CP Phase 2 SPP 195 99.4 99.4 66.3
2017 25-27/2044 Note: Equity capacity includes 100% stake in GLOW, GRP and ERU
64 Note: Equity capacity includes 100% stake in GLOW, GRP and ERU Name Type Total capacity (MW) Equity Power capacity (MW) Equity Operating Power capacity (MW) Steam (T/H) Industrial water (Cu.m/H) Direct shareholding (%) COD Tenor IN OPERATION NNEG SPP 125 38 38 9
2016 25/2041 NNEG Expansion SPP 60 18
2020 25/2041 Rayong Expansion (CUP-3) SPP 15 15 15
2019 n/a Rayong Expansion (CUP-4) SPP 45 45 45 70
2019
2,614 2,192 2,174 2,701 7,292 VSPP and others CHPP VSPP 5 5 5
2008 30/2038 CHPP (Solar) VSPP 5 5 5
2016 2041 Glow Energy Solar Plant VSPP 1.55 1.55 1.55
2012 20-25 TSR (SSE1) VSPP 80 32 32
2013 25/2038 Glow Energy Solar PV Rooftop VSPP 0.87 0.87 0.87
2019 15 Glow Energy Solar PV Rooftop VSPP 1 1 1
2019 15 ISP1 Solar 20.8 20.59 20.59
2017 20/2037 GRP VSPP 39.5 39.5 39,5
2014-15 2039/2040 NL1PC Hydro 65 26 26
2019 27/2044 Chonburi Clean Energy (CCE) VSPP 8.6 2.87 2.87
2019 20 Rayong WTE VSPP 9.8 9.8
2021 18/2039 Total VSPP and others 237 145 134.5
ERU Cogen 250 250
2023 25/2048 Total ERU 250 250
8,011 5,026 4,748 2,876 7,372
65
GTG HGPI Hot Gas Path Inspection for Gas Turbine 14 days MI Major Inspection for Gas Turbine 22 days STG Minor Minor Inspection for Steam Turbine 15 days 1MO 2nd Major Overhaul for Steam Turbine 23 days 2MO 2nd Major Overhaul for Steam Turbine 27 days AB 1Y One Year Inspection Aux. Boiler 11 days 3Y Three Year Inspection Aux. Boiler 13 days GTG CI Combustion Inspection for Gas Turbine 8 days HGPI Hot Gas Path Inspection for Gas Turbine 26 days MO Major Overhaul for Gas Turbine 33 days RCIE Rotor and Casting Inspection Evaluation 49 days HRSG 1Y One Year Inspection HRSG 8 days 3Y Three Year Inspection HRSG 33 days Other 1Y One Year Inspection NG Station Test Online 5Y Five Year Inspection NG Station (NDT) Online FO Forced Outage Depending on physical damage HRSG 1Y One Year Inspection HRSG 11 days 3Y Three Year Inspection HRSG 14 days Others 1Y One Year Inspection NG Station Test Online 5Y Five Year Inspection NG Station (NDT) Online FO Forced Outage Depending on physical damage Notes: Rayong Site Notes: Sriracha Site
66
Plant Unit 2020
Q1 (F) Q2 (F) Q3 (F) Q4 (F)
IRPC-CP Block 1 CTG 21 HRSG 21 CTG 22 HRSG 22 STG 23 Block 2 CTG 31 HRSG 31 CTG 32 HRSG 32 STG 33
6 6 6 6 6 1 1 1 1 1 1 1 1 1 1 1 1 1 1 1 1 6 1 1 6 1 1 1 1 1 6 6 1 7 6
Notes: YI Yearly Inspection 5 days YI Yearly Inspection Aux Boiler 15 days 1 = 1 Day (24 hours) 3 = 3 Days (72 hours) 6 = 6 Days (144 hours) 7 = 7 Days (168 hours)
67
Main Units Planned Maintenance Duration (Days) 2017 2018 2019 2020 2020 by quarter Q1 Q2 Q3 Q4 GHECO-One 36
38 27 5 25 CFB 2 27 5 21 23 CFB 3 7 26 45 3 Phase 5 31 5 23
2 21 3
68
69 Items Book Value of GLOW Fair Value of GLOW Differential Value Assets 107,655 155,500 47,845 Liabilities (56,246) (66,497) (10,251) Net Assets of GLOW at 14 March 2019 51,409 89,003 37,594 Non-Controlling interests at 30.89% (32,092) Total Net Asset
69.11% 56,911 Goodwill 36,090 Proportion of acquisition cost 69.11% 93,001
GPSC has completed the acquisition of 69.11% on 14 March 2019 at a total of THB 93,001 million, the company has measured the fair value of GLOW net assets as follows:
remaining period of the contract, 5 to 31 years).
Amortization of Fair Value Measured from Net Assets acquired from GLOW during 2019 - 2051 (Computed based on 100% of GLOW shares)
2019 2021 2023 2025 2027 2029 2031 2033 2035 2037 2039 2041 2043 2045 2047 2049 2051
200 400 600 800 1,000 1,200 1,400 1,600 1,800 2,000 THB million
unit: THB million
70
TFRS 9
Assets As-Is GPSC Policy Impacts on TFRS 9
(e.g. IRS ,CCS , FW)
information
investments (e.g. RPCL, 24M)
presented in the statement of income
are not presented in the statement of income
(e.g. receivables, loans)
information
the debtor which may cause impairment faster
Assets Liabilities Off balance
Right-of-use assets and Lease liabilities
Not recorded Not recorded
Right-of-use assets
Lease liabilities
Balance Sheet Revenue
TFRS 16 Profit & Loss SG&A EBITDA Depreciation EBIT Finance cost EBT
TFRS 16 (Accounting for lessees)
Current
Interest from lease agreement
71 9,067 18,279
18,308
Q1/19 Q4/19 Q1/20 27% 25%
29%
Gross profit Margin Total Revenue
REVENUE & GROSS PROFIT MARGIN | THB million, % GROSS PROFIT MARGIN REVENUE Q1/2020 REVENUE BY PRODUCT | THB million, %
TOTAL
18,308
QoQ: Increased due to higher dispatch volume due to EGAT instruction and higher AP in Q1/2020 as IPP plants reached the Contracted Availability Hours (CAH) in Dec 2019 despite decrease in electricity and steam sales revenue of SPP plants to industrial customers due to customers’ planned maintenance YoY: Increased due to full quarter recognition of GLOW’s performance QoQ: Increased due to: 1) Higher AP from THB depreciation against USD and no planned maintenance shutdown of IPP power plants in Q1/2020; 2) Decreased in natural gas and coal price and the lower maintenance cost due to no maintenance shutdown of SPP plants YoY: Increased due to full quarter recognition of GLOW’s performance and
QoQ
+4%
YoY
+2%
QoQ
+0.2%
YoY
+102%
Electricity | 23% (IPP) Electricity | 54% (SPP+IUs) Steam | 21% Others | 2%
*Adjusted Net Income is net profit attributed to the company adjusted to reflect the company's true earnings from its normal operations which excludes: fair value of intangible asset from the acquisition of GLOW (PPA Amortization).
EBITDA & EBITDA MARGIN | THB million, %
NET PROFIT & ADJUSTED NET INCOME* | THB million
QoQ
+20%
YoY
+134%
QoQ
+27%
YoY
+107%
942 1,145 1,580 384 368 Q1/19 Q4/19 Q1/20 2,112 4,116
4,951
Q1/19 Q4/19 Q1/20
1,948
Net Profit PPA Amortization Adjusted NI
23% 23%
27%
EBITDA margin
1,529
EBITDA
942
QoQ: Increased due to: 1) Increased AP from THB depreciation against USD and no planned maintenance shutdown in Q1/2020. 2) Decreased natural gas and coal price and the lower maintenance costs 3) Lower SG&A which mainly from the acquisition of GLOW YoY: Increased due to full quarter recognition of GLOW’s performance and other factors similar to QoQ QoQ: Adjusted Net Income increased due to: 1) Increased in AP of Sriracha Power Plant and GHECO-One due to no planned maintenance shutdown in Q1/2020 and depreciation of THB against USD 2) Decreased in cost of natural gas and coal 3) Decreased in finance costs from the company’s financial deleveraging plan YoY: Adjusted Net Income increased due to full quarter recognition of GLOW’s performance and other factors similar to QoQ
72
73
VSPP & others
REVENUE BY TYPE OF POWER PLANT | THB million
TOTAL REVENUE IPP REVENUE SPP REVENUE
QoQ
+0.2%
YoY
+102%
QoQ
+21%
YoY
+165%
1,740 3,814 4,604 7,189 14,343 13,579 138 122 125 9,067 18,279
18,308
Q1/19 Q4/19 Q1/20
SPP IPP
VSPP AND OTHERS' REVENUE
QoQ
YoY
+89%
QoQ
+2%
YoY
QoQ: Increased mainly from: 1) Higher AP from depreciation of THB against USD 2) No planned maintenance shutdown of Sriracha Power Plant and GHECO-One in the mid-December YoY: Increased due to full quarter recognition of GLOW’s performance and higher AP from depreciation of THB against USD QoQ: Decreased mainly from lower electricity and steam sales volume from the maintenance shutdown of industrial customers and decreased in natural gas price during Q1/2020 YoY: Increased due to full quarter recognition of GLOW’s performance QoQ: Increased from electricity sales of ISP1 and higher sales volume of chilled water of CHPP YoY: Decreased mainly from lower revenue from solar cell installation business unit of CHPP QoQ: Increased due to higher dispatch volume due to EGAT instruction and higher AP in Q1/2020 as IPP plants reached the Contracted Availability Hours in Dec 2019 despite decrease in electricity and steam sales revenue of SPP plants to industrial customers due to customers’ planned maintenance YoY: Increased due to full quarter recognition of GLOW’s performance
74
VSPP & others
GROSS PROFIT & GROSS PROFIT MARGIN BY TYPE OF POWER PLANT | THB million, %
TOTAL GROSS PROFIT IPP GROSS PROFIT SPP GROSS PROFIT
QoQ
+17%
YoY
+117%
QoQ
+38%
YoY
+131%
SPP IPP
VSPP AND OTHERS' GROSS PROFIT
QoQ
+11%
YoY
+117%
QoQ
YoY
QoQ: Increased due to lower natural gas and coal price and lower maintenance cost due to no major maintenance shutdown in Q1/2020 YoY: Increased due to the full quarter recognition of GLOW’s performance QoQ: Decreased mainly from higher cost of sales and lower revenue received from solar cell installment business unit of CHPP YoY: Decreased mainly from lower revenue received from solar cell installment business unit of CHPP and high operating cost of RDF power plant QoQ: Increased due to the higher AP due to no planned maintenance shutdown of Sriracha Power Plant and GHECO-One and depreciation of THB against USD in Q1/2020 YoY: Increased due to full quarter recognition of GLOW’s performance and depreciation of THB against USD in Q1/2020 QoQ: Increased due to: 1) Higher AP from THB depreciation against USD and no planned maintenance shutdown of IPP plants in Q1/2020 2) Lower natural gas and coal price and the lower maintenance cost due to no maintenance shutdown of SPP power plants YoY: Increased due to full quarter recognition of GLOW’s performance 632 1,058 1,459 1,769 3,468 3,834 177 182 72 2,477 4,599
5,365
Q1/19 Q4/19 Q1/20 27% 25%
29%
Gross profit margin
REVENUE | THB million
GROSS PROFIT & GROSS PROFIT MARGIN | THB million,% QoQ
+21%
YoY
+165%
QoQ
+38%
YoY
+131%
1,740 3,814
4,604
Q1/19 Q4/19 Q1/20
Gross Profit Gross Profit Margin
36% 28%
32%
75
IPP TOTAL REVENUE
GROSS PROFIT
IPP POWER PLANTS
Sriracha HHPC GHECO-One GIPP
*GLOW IPPs consist of GIPP, GHECO-One and HHPC
QoQ: Increased due to the higher AP due to no planned maintenance shutdown of GHECO-One and Sriracha Power Plant and depreciation of THB against USD in Q1/2020 YoY: Increased due to the full quarter recognition of GLOW’s performance and depreciation of THB against USD in Q1/2020 QoQ: Increased mainly from: 1) Higher AP from depreciation of THB against USD 2) No planned maintenance shutdown of Sriracha Power Plant and GHECO-One in the mid-December YoY: Increased due to full period recognition of GLOW’s performance and higher AP from depreciation of THB against USD
632 1,058
1,459
Q1/19 Q4/19 Q1/20 3.50 2.55
2.47
497 1,495
1,868
Q1/19 Q4/19 Q1/20
SALES VOLUME | G W h
Average selling price (THB/kWh) Sales Volume (GWh)
AVAILABILITY PAYMENT | THB million
AP
Sriracha
QoQ
+20%
YoY
+197%
498 1,229
1,477
Q1/19 Q4/19 Q1/20 76
IPP AVAILABILITY RATE | %
AP
GIPP
QoQ: AR slightly increased due to planned maintenance for 10 days in December 2019 YoY: AR slightly decreased due the shutdown of the plant AR of GIPP maintained at 100% QoQ: AR increased due to the plant reached the Contracted Availability Hours (CAH) in mid-December 2019 YoY: AR slightly decreased due the shutdown of the plant QoQ: AP increased due to depreciation of THB against USD and no planned maintenance shutdown of Sriracha Power Plant and GHECO-One in Q1/2020 YoY: Increased due to the full period recognition
GLOW’s performance and higher AP from depreciation of THB against USD.
100% 92%
96%
Q1/19 Q4/19 Q1/20
Sriracha GHECO-One GIPP
100% 100%
100%
99% 90%
95%
ENERGY PAYMENT | THB million
QoQ
+22%
YoY
+175%
QoQ: EP increased due to higher energy dispatch YoY: Increased due to 1) Full quarter recognition of EP from all 3 Glow’s IPP plants in Q1/2020 while in Q1/2019,
EP from 18 days was recognized. 2) No planned maintenance of GHECO-One in 2020
1,053 2,370
2,894
Q1/19 Q4/19 Q1/20
AP
GHECO- One
Availability Payment increased due to depreciation of THB and no planned maintenance in Q1/2020
Energy Payment increased 175% YoY and 22% QoQ
SPP REVENUE | THB million
GROSS PROFIT & GROSS PROFIT MARGIN | THB million,% QoQ
YoY
+89%
QoQ
+11%
YoY
+117%
Gross Profit Gross Profit Margin
25% 24%
28%
77
SPP TOTAL REVENUE
GROSS PROFIT
SPP POWER PLANTS
1,769 3,468
3,834
Q1/19 Q4/19 Q1/20 66% 71% 73% 32% 27% 26% 2% 1% 1% 7,189 14,343
13,579
Q1/19 Q4/19 Q1/20
Electricity Steam Others
CUP-2 CUP-1 CUP-3 IRPC-CP GLOW SPP 2-3 GLOW Energy Phase 1,2,4,5 GLOW SPP 11 Phase 1-3 GLOW CFB3 CUP-4
QoQ: Decreased due to lower electricity and steam sales volume to industrial users due to their planned maintenance shutdown. YoY: Increased due to full quarter recognition of revenue from electricity and steam sales of all Glow’s SPP plants in Q1/2020 (in Q1/2019, only revenue from 18 days was recognized) despite a drop in revenue from GPSC’s SPPs.
QoQ: Increased due to decreased cost of natural gas and maintenance due to no major maintenance shutdown in Q1/2020 of Glow SPPs despite decreased gross profit from GPSC’s SPPs. YoY: Increased due to full quarter recognition of gross profit of Glow’s SPPs in Q1/2020 (in Q1/2019, only gross profit from 18 days was recognized) despite a drop in gross profit from GPSC’s SPPs.
POWER SALES | THB million
QoQ
YoY
+107%
78
SPP
4,776 10,238
9,881
Q1/19 Q4/19 Q1/20
GPSC GLOW
POWER SALES VOLUME | GWh
1,056 1,099 1,018 497 2,319 2,201 1,553 3,418
3,219
Q1/19 Q4/19 Q1/20
AVERAGE SELLING PRICE | THB/kWh Ft RATE | THB
3.08 2.99
3.07
Q1/19 Q4/19 Q1/20
Q1/19* Q4/19 Q1/20 Note: * -0.159 in Jan 2019, -0.116 in Feb and Mar 2019
QoQ: Power sales decreased mainly due to lower sales volume to industrial users due to their planned maintenance shutdown despite slight increase in average selling price. YoY: Power sales increased mainly due to full quarter recognition of power sales volume of all Glow’s SPP plants in Q1/2020 (in Q1/2019, only power sales from 18 days was recognized) despite a drop in power sales from GPSC’s SPPs.
STEAM SALES | THB million
QoQ
YoY
+54%
79
SPP
2,286 3,901
3,513
Q1/19 Q4/19 Q1/20
GPSC GLOW
STEAM SALES VOLUME | ‘000 tons
1,587 1,690 1,598 374 1,918 1,656 1,961 3,608
3,254
Q1/19 Q4/19 Q1/20
AVERAGE STEAM SELLING PRICE | THB/ton AVERAGE NATURAL GAS PRICE | THB/MMBTU
QoQ: Steam sales decreased mainly due to lower sales volume due to industrial users’ maintenance shutdown and slight decrease in average selling price. YoY: Steam sales increased mainly due to full quarter recognition of steam sales volume of all Glow’s SPP plants in Q1/2020 (in Q1/2019,
steam sales from 18 days was recognized) and slight increase in steam sales volume from GPSC’s SPPs.
1,165 1,081
1,080
Q1/19 Q4/19 Q1/20 291 278
273
Q1/19 Q4/19 Q1/20
80
TOTAL COSTS OF SALES AND SERVICES* | THB million, %
TOTAL COSTS NATURAL GAS COST COAL COST
QoQ
YoY
+96%
QoQ
YoY
+73% MAINTENANCE COST
QoQ
+7%
YoY
+339%
QoQ
YoY
+130%
QoQ: Decreased mainly due to lower average natural gas price and consumption volume of SPP plants YoY: Increased mainly from the full recognition of costs of GLOW’s power plants in Q1/2020 comparing to only 18-day recognition in Q1/2019. QoQ: Increased due to higher coal consumption of both GHECO-One (GHECO-One has reached the Contracted Availability Hours in mid- December 2019) and Glow’s SPPs in Q1/2020. YoY: Increased mainly due to the recognition of GLOW’s power plants. QoQ: Maintenance cost decreased due to no planned maintenance shutdown in Q1/2020 comparing to planned maintenance shutdown from both of Glow energy plants and Sriracha power plant in Q4/2019. YoY: maintenance cost increased due to full recognition
maintenance cost of Glow’s facilities in Q1/2020 (2019 planned maintenance of GHECO-One ended before acquisition of GPSC) QoQ: Decreased mainly due to lower average natural gas price and consumption volume of SPP plants despite increase in natural gas costs of IPP plants corresponding to higher dispatch to EGAT. YoY: Increased mainly due to full recognition of GLOW’s costs in Q1/2020 and higher distich to EGAT from Sriracha Power Plant despite decrease in average natural gas price. Note: *excluding depreciation and amortization
Natural gas (IPP) Natural gas (SPP+VSPP) Other costs Coal Maintenance costs
69% 62%
60%
9% 5%
8%
8% 16%
18%
3% 7%
4%
11% 10%
10%
6,590 13,680
12,943
Q1/19 Q4/19 Q1/20
81 1,420 3,336 3,667 612 1,383 3,670 1,227 976
3,125
12,178 12,431 12,268 12,468 15,684 29,440 31,110 30,610
28,312
Q1/18 Q2/18 Q3/18 Q4/18 Q1/19 Q2/19 Q3/19 Q4/19 Q1/20 IPP 258* SPP 273
Average Monthly Natural Gas Price
(THB/MMBTU)
Quarterly Natural Gas Consumption (‘000 MMBTU)
IPP SPP
QUARTERLY NATURAL GAS CONSUMPTION & MONTHLY NATURAL GAS PRICE | ‘000 MMBTU, THB/MMBTU
*Excluding GLOW IPP
82
TOTAL ASSETS | THB million,%
TOTAL LIABILITIES & SHAREHOLDERS EQUITY | THB million,%
ASSETS
EQUITY
LIABILITIE S
+1%
Total liabilities increased mainly from:
decrease in short-term loans by THB 15,253 million due to repayment
long-term loans with banks to repay short-term loans
from the recognition of long-term lease liabilities (implementation of TFRS16) of THB 2,527 million and from the recognition of derivative liabilities (implementation of TFRS9) of THB 2,187 million. Total assets slightly decreased mainly from:
mainly due to the decrease of cash and cash equivalent by THB 5,569 million
THB 1,491 million mainly from the acquisition of the solar power plant on 26 March 2020
2,726 million mainly due to the increase of right of use assets in the amount of THB 2,644 million Total Equity decreased mainly from:
1,980 million due to implementation of TFRS 9
83
TOTAL D/E & NET D/E | times
INTEREST COVERAGE RATIO | times
ROE | %
EARNING PER SHARE (EPS) | THB/share
2.70x 1.29x
1.34x
1.96x 0.78x
0.82x
Q1/19 Q4/19 Q1/20
Total D/E Net D/E
3.82x 1.70x
2.76x
Q1/19 Q4/19 Q1/20 8.41 5.76
6.77
Q1/19 Q4/19 Q1/20
0.63 0.64
0.56
Q1/19 Q4/19 Q1/20
Disclaimer The information contained here is being furnish on a confidential basis for discussion purposes only and only for the use of the recipient, and may be subject to completion or amendment through the delivery of additional documentation. Except as otherwise provided herein, this document does not constitute an offer to sell or purchase any security of engage in any transaction. The information contained herein has been obtained from sources that Global Power Synergy Public Company Limited (“GPSC”) considers to be reliable; however, GPSC makes no representation as to, and accepts no responsibility or liability for, the accuracy or completeness of the information contained herein. Any projections, valuations and statistical analyses contained herein have been provided to assist the recipient in the evaluation of the matters described herein; such projections, valuations and analyses may be based on subjective assessments and assumptions and may utilize one among alternative methodologies that produce differing results; accordingly, such projections, valuations and statistical analyses are not to be viewed as facts and should not be relied upon as an accurate representation of future events. The recipient should make an independent evaluation and judgement with respect to the matters contained herein.