
SLIDE 1
21 May 2018 1
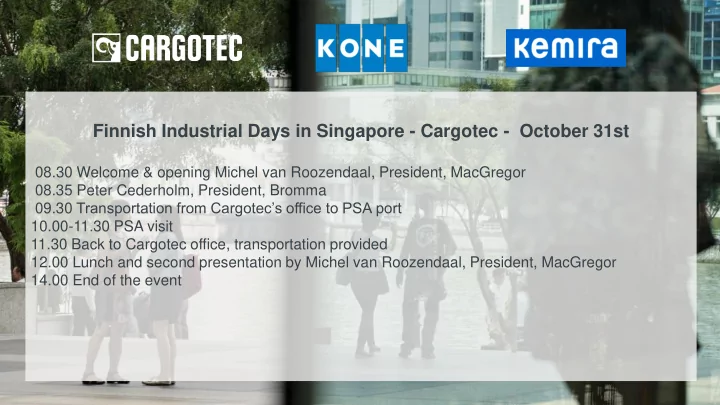
Finnish Industrial Days in Singapore - Cargotec - October 31st
08.30 Welcome & opening Michel van Roozendaal, President, MacGregor 08.35 Peter Cederholm, President, Bromma 09.30 Transportation from Cargotec’s office to PSA port 10.00-11.30 PSA visit 11.30 Back to Cargotec office, transportation provided 12.00 Lunch and second presentation by Michel van Roozendaal, President, MacGregor 14.00 End of the event