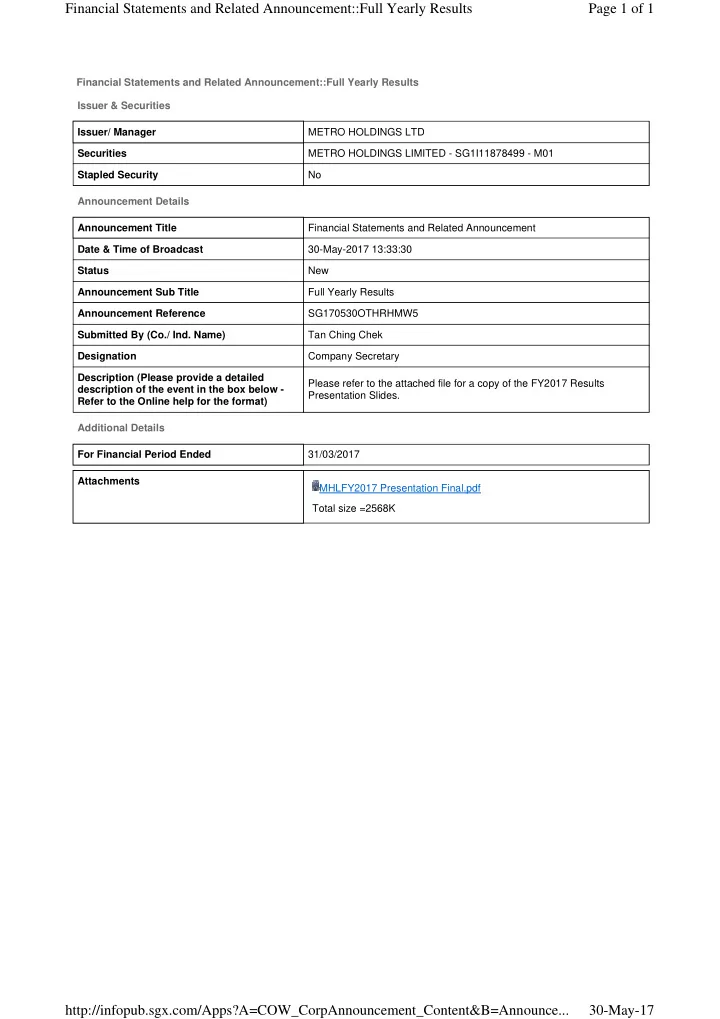

Financial Statements and Related Announcement::Full Yearly Results Issuer & Securities Issuer/ Manager METRO HOLDINGS LTD Securities METRO HOLDINGS LIMITED - SG1I11878499 - M01 Stapled Security No Announcement Details Announcement Title Financial Statements and Related Announcement Date & Time of Broadcast 30-May-2017 13:33:30 Status New Announcement Sub Title Full Yearly Results Announcement Reference SG170530OTHRHMW5 Submitted By (Co./ Ind. Name) Tan Ching Chek Designation Company Secretary Description (Please provide a detailed description of the event in the box below - Refer to the Online help for the format) Please refer to the attached file for a copy of the FY2017 Results Presentation Slides. Additional Details For Financial Period Ended 31/03/2017 Attachments MHLFY2017 Presentation Final.pdf Total size =2568K
Page 1 of 1 Financial Statements and Related Announcement::Full Yearly Results 30-May-17 http://infopub.sgx.com/Apps?A=COW_CorpAnnouncement_Content&B=Announce...