Feasibility of I m plem enting I nternational "Pedestrian - - PowerPoint PPT Presentation

feasibility of i m plem enting i nternational quot
SMART_READER_LITE
LIVE PREVIEW

Feasibility of I m plem enting I nternational "Pedestrian - - PowerPoint PPT Presentation

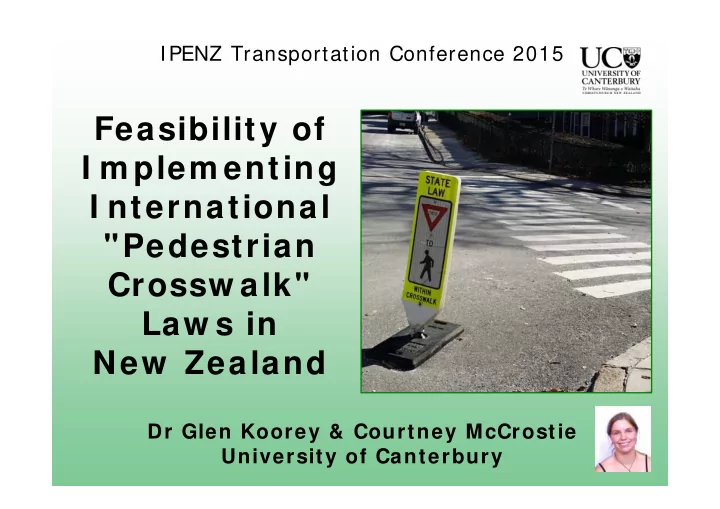
IPENZ Transportation Conference 2015 Feasibility of I m plem enting I nternational "Pedestrian Crossw alk" Law s in New Zealand Dr Glen Koorey & Courtney McCrostie University of Canterbury Presentation Outline Road rules


slide-1
SLIDE 1

Feasibility of I m plem enting I nternational "Pedestrian Crossw alk" Law s in New Zealand

IPENZ Transportation Conference 2015 Dr Glen Koorey & Courtney McCrostie University of Canterbury

slide-2
SLIDE 2

Presentation Outline

  • Road rules in New Zealand and overseas
  • Research Objectives
  • Crash data analysis
  • Perception survey
  • Delay modelling
  • Conclusions
  • Recommendations
slide-3
SLIDE 3

New Zealand’s Pedestrian Crossw alk Law s

  • In New Zealand

drivers only have to give way to pedestrians at

  • Signalised

pedestrian crossings

  • Zebra crossings
  • Driveways
  • Shared space zones
  • But NOT unsignalised intersections
slide-4
SLIDE 4

NZ: No Priority Here

slide-5
SLIDE 5

Overseas Pedestrian Crossw alk Law s

  • “Vehicles do not have

an automatic right of way on the road”

  • Ireland Road Safety

Authority, 2013

  • “…

a driver must slow down when approaching an intersection and be prepared to come to a complete stop if a vehicle or pedestrian with right-of-way is approaching from another direction.”

  • Indiana Bureau of Motor Vehicles, 2013
slide-6
SLIDE 6

US: Three Legal Crossw alks

slide-7
SLIDE 7

Research Objectives

  • Identify the effects different laws have on

pedestrian behaviour and safety

  • Determine the public’s preferences and

understanding of law change options

  • Determine the effects of rule changes on

both pedestrian & motorist delays

  • Consider the practical aspects of

introducing a law change in New Zealand

slide-8
SLIDE 8
  • CAS Data: Jan ‘09 – Jul ‘14 (> 1750 crashes)

Movem ents I nvolved in Pedestrian Crashes

0% 5% 10% 15% 20% 25% 30% 35% 40% 45% 50%

Signalised Unsignalised

  • Overseas ped’n crash data not as detailed
slide-9
SLIDE 9
  • Online Survey (sample size = 876)

0% 10% 20% 30% 40% 50% 60% 70% 80% 90% 100%

Incorrect Correct

Understanding of the Current Road Rules

slide-10
SLIDE 10

W illingness to Give W ay to Pedestrians

0% 10% 20% 30% 40% 50% 60%

Yes Yes, with markings No

slide-11
SLIDE 11
  • “Ladder” style

most popular

Potential Crossw alk Markings

slide-12
SLIDE 12

Overall W illingness to Give W ay to Pedestrians

0% 10% 20% 30% 40% 50% Yes Yes, with markings No

Often by foot, rarely by car Often by car and foot Often by car, rarely by foot

slide-13
SLIDE 13

Delay Modelling Overview

  • PTV Vissim 6
  • Microscopic
  • Multi-modal
  • Two layouts considered
  • T intersection
  • X intersection
  • Nine flow combinations
  • Max/ Med/ Min ped’ns
  • Max/ Med/ Min vehicles
slide-14
SLIDE 14

Change in Pedestrian and Vehicle Travel Tim e ( secs/ hr)

T I ntersection X I ntersection Ped tim e saved Vehicle Vehicle Max Med Min Max Med Min Pedestrian Max 1360 366 144 Pedestrian Max 2425 588 193 Med 432 135 35 Med 942 310 81 Min 144 89

  • 6

Min 309 95

  • 8

Veh tim e lost Vehicle Vehicle Max Med Min Max Med Min Pedestrian Max

  • 1599
  • 476
  • 133

Pedestrian Max

  • 4069
  • 1408
  • 280

Med

  • 461
  • 150
  • 46

Med

  • 1104
  • 316
  • 99

Min

  • 110
  • 44
  • 18

Min

  • 1109
  • 38
  • 33
slide-15
SLIDE 15

Delay Modelling: Cost of I m plem enting Change

Using EEM Costs:

  • Approx. Yearly cost
  • T Intersection = $1,979
  • X Intersection = $11,939
  • 40-year life-cycle cost
  • T Intersection = $30,661
  • X Intersection = $184,975

c.f. Cost of pedestrian fatality in 50km/ h zone = $3.05 million

Max Med Min

slide-16
SLIDE 16

Project Lim itations

  • Crash data
  • Unable to compare to overseas
  • Didn’t look at motor veh crashes e.g. rear-end
  • Unable to estimate absolute safety effects
  • Use VISSIM conflicts as surrogate measure?
  • Online Survey
  • Relying on what people say they w ould do
  • Response bias?
  • Delay Modelling
  • Traffic behaviour assumptions in Vissim
slide-17
SLIDE 17

Practical Aspects of I m plem entation

  • All Inters’ns or just Specially Marked Ones?
  • What Crosswalk Markings to Use?
  • Roundabouts?
  • Required Road

User Education?

  • Effect on Road

User “Culture”?

slide-18
SLIDE 18

Use existing Zebra Xing?

slide-19
SLIDE 19

Cyclist Priority at Sideroads?

slide-20
SLIDE 20

Conclusions

  • Safety effects unclear (esp. absolute no.s)
  • Expect that crash patterns at unsignalised

intersections will become sim ilar to those at signalised intersections

  • 78% of people are already willing to give

way to pedestrians

  • Life-cycle delay costs of change per

intersection are relatively negligible No reason so far to dismiss a law change

slide-21
SLIDE 21

Recom m endations

  • Further research on the possible safety

effects of a law change

  • Surrogate safety modelling with Vissim?
  • Physical/ Simulator trials at select sites
  • A more in-depth look at the economic

benefits and costs of a law change

  • Particularly with any Safety assessment
  • Additional study on the effect of different

types of crosswalk markings

slide-22
SLIDE 22

Thank You!

  • Any Questions?
slide-23
SLIDE 23

Factors Contributing to Pedestrian Crashes

0% 10% 20% 30% 40% 50% Alcohol/ Drugs (driver) Alcohol/ Drugs (non-driver) Failed Give Way/ Stop Poor Handling Poor Observation Poor Judgement Pedestrian Factors Road Factors Weather Other

Signalised Unsignalised

1 2 % 2 6 % 4 6 %

slide-24
SLIDE 24

“Pedestrian Factors” Contributing to Ped’n Crashes

0% 2% 4% 6% 8% 10% 12% 14% 16%

Crossing road Walking heedless of traffic Stepping out from behind vehicles Running heedless of traffic Not complying with traffic signal Miscellaneous

Signalised Unsignalised