Experimental/Analytical Evaluation of the Effect of Tip Mass on - - PowerPoint PPT Presentation

experimental analytical evaluation of the effect of tip
SMART_READER_LITE
LIVE PREVIEW

Experimental/Analytical Evaluation of the Effect of Tip Mass on - - PowerPoint PPT Presentation

Experimental/Analytical Evaluation of the Effect of Tip Mass on Atomic Force Microscope Calibration Scanning electron Matthew S. Allen microscope image of AFM cantilever and Assistant Professor University of Wisconsin-Madison probe tip


slide-1
SLIDE 1

Matthew S. Allen

Assistant Professor – University of Wisconsin-Madison

Hartono Sumali

Principal Member of Technical Staff – Sandia National Laboratories

Elliott B. Locke

Undergraduate Research Assistant - University of Wisconsin-Madison

February, 2008

Experimental/Analytical Evaluation of the Effect of Tip Mass on Atomic Force Microscope Calibration

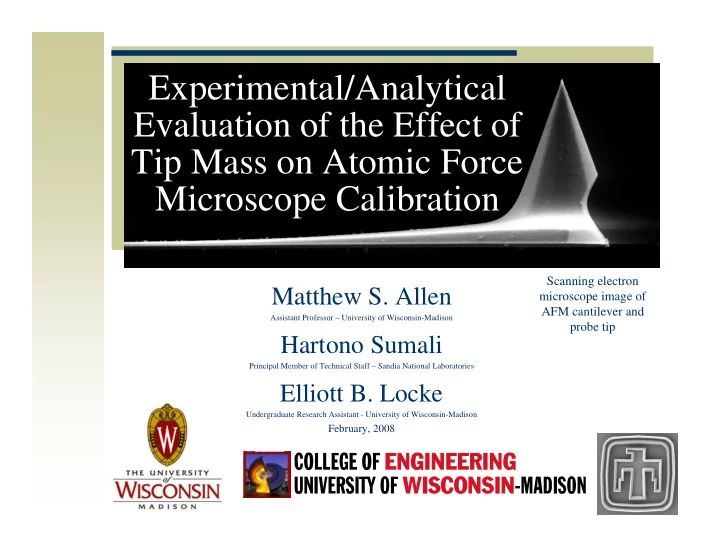
Scanning electron microscope image of AFM cantilever and probe tip

slide-2
SLIDE 2

2

Atomic Force Microscopy Atomic Force Microscopy

AFM: A mechanical detection system for studying materials at the nanoscale.

Developed in 1986 by

Binnig, Quate, and Gerber in a collaboration between IBM and Stanford University

Laser based detection system:

Sub nanometer

displacement resolution.

Sub nano-Newton force

resolution.

Schematic: R. Carpick

slide-3
SLIDE 3

3

Optical & AFM Images Optical & AFM Images

Optical Image AFM Images

Slide courtesy of VEECO

  • AFM can produce

quantitative topology (x,y,z coordinates)

  • Versatile: Images of

topography, material stiffness and viscoelasticity, etc…

slide-4
SLIDE 4

4

Calibration Calibration

How does one calibrate the world’s smallest force sensor?

Calibration procedures approximate the probe as

an Euler Bernoulli beam and find effective mass and stiffness from vibration measurements.

slide-5
SLIDE 5

5

Problem Problem

Tip mass is neglected in all available AFM calibration procedures. How large of an effect does this have on their accuracy?

Tip mass may be 50% or more of beam’s effective mass

slide-6
SLIDE 6

6

Outline Outline

Calibration Procedures

Method of Sader Thermal Tune (Hutter and Beechoefer)

Modifications to account for tip mass Experimental Application

Tip mass estimated from SEM images Experimentally procedure to measure mode

shapes and frequencies

Comparison with analytical models

Conclusions

slide-7
SLIDE 7

7

Calibration: Method of Sader Calibration: Method of Sader

Measure:

Natural frequency & damping ratio AFM probe’s in-plane dimensions (optical image) Density & viscosity of air

Solve fluid-structure interaction problem to obtain:

area density & stiffness of the AFM probe.

This is one of the most convenient calibration procedures available and is widely used by AFM users and probe manufacturers. Sader’s method assumes beam with rectangular cross section and constant properties along the length of the beam. Tip is not included!

air/fluid flow

slide-8
SLIDE 8

8

Calibration: Thermal Tune Calibration: Thermal Tune

Initially presented by Hutter and Bechhoefer (1993) Measure:

Power spectrum of cantilever

  • scillating freely under the influence of

thermal excitation

Temperature of probe displacement sensitivity of

photodetector

Equipartition theorem relates the RMS amplitude of vibration of each mode with the temperature. Derivation assumes beam with constant cross section and neglects the effect of the tip.

slide-9
SLIDE 9

9

Extensions Extensions Can one modify either of these methods to account for the tip mass? … YES!

air/fluid flow

slide-10
SLIDE 10

10

Include Tip Mass in Method of Sader Include Tip Mass in Method of Sader

Solution of fluid dynamic equations gives the force applied to the beam as a function of frequency: Include hydrodynamic force and tip-mass in single-term Ritz model for cantilever

( ) ( ) ( )

2 2

, , 4

hydro f

F x b W x π ω ρ ω ω ω = Γ ( ) ( )

( )

( ) ( )

2 2 2 2 11 2 2 11 11

4 4 3

t c f r t m m s f i

I d hbL b L m m x x Y dx L k i b L m Y k Y π ω ρ ρ ω ψ ψ π ω ρ ω ω ⎡ ⎤ ⎛ ⎞ ⎛ ⎞ − + Γ + + + ⎢ ⎥ ⎜ ⎟ ⎜ ⎟ ⎝ ⎠ ⎝ ⎠ ⎢ ⎥ ⎣ ⎦ ⎡ ⎤ ⎡ ⎤ Γ + = ⎢ ⎥ ⎢ ⎥ ⎣ ⎦ ⎣ ⎦

beam mass fluid mass tip mass tip inertia basis function: mode function for cantilever beam fluid damping effect beam stiffness ( )

( ) ( ) ( ) ( )

1 1 1 1 1

sin sinh cos cosh x x x R x x ψ α α α α ⎡ ⎤ = − + − ⎣ ⎦

slide-11
SLIDE 11

11

Include Tip Mass in Method of Sader (2) Include Tip Mass in Method of Sader (2)

Using mode shapes of an ideal cantilever beam as basis functions: Invert the procedure to solve for the area density and spring constant from fn and Q = 1/(2ζ) ( )

( )

( )

1 2 11 2 1 2 11 2

1.8556 22.94 m x dx d k x dx dx ψ ψ = ≈ ⎛ ⎞ = ≈ ⎜ ⎟ ⎝ ⎠

∫ ∫

( ) ( ) ( )

( )

( )

2 2 3 11 11

1 4 2

t t c f i r m m

m I d h b x x bLm bL m dx π ρ ρ ω ω ψ ψ ζ ⎛ ⎞ ⎛ ⎞ = Γ − Γ − − ⎜ ⎟ ⎜ ⎟ ⎝ ⎠ ⎝ ⎠

( )

2 11 2 11

3 4

f i s n

b Lm k Q k πρ ω ω Γ =

Tip mass falls out

  • f expression for ks!

term from Sader

slide-12
SLIDE 12

12

Include Tip Mass in Method of Sader (3) Include Tip Mass in Method of Sader (3) Conclusions:

Sader’s method accurately estimates the stiffness

  • f AFM cantilever probes even when the tip mass

is ignored, so long as the mode function is accurate!

Sader’s method overestimates the area density of

the AFM probe when the tip mass is neglected.

Does the AFM probe’s tip mass alter the mode shapes of the probe significantly?

slide-13
SLIDE 13

13

Experimental Procedure Experimental Procedure

Operating deflection shapes of cantilever probes measured using Polytec Micro Systems Analyzer (Laser Vibrometer) at Sandia National Labs. Base excited by a piezoelectric wafer. Pseudo-random excitation used, centered

  • n each mode

sequentially. Mode shapes measured both in vacuum and at ambient pressure.

slide-14
SLIDE 14

14

Tip Mass Estimation Tip Mass Estimation

Tip volume estimated from SEM images:

1633 μm3

Nominal beam volume:

350μm × 35 μm ×

1μm = 12250 μm3

Significant? If the densities are the same:

Tip mass is 13% of

beam mass.

Tip mass is 54% of

the effective mass of the beam! (Effective mass of beam is 0.25*mbeam)

slide-15
SLIDE 15

15

Experimental Mode Shapes Experimental Mode Shapes

1st experimental mode is almost identical to analytical shape for a cantilever without a tip mass. Experimentally measured mode shapes are significantly different from the analytical shapes for modes 2-4. Tip motion is reduced as one would expect due to the added mass.

50 100 150 200 250 300 350

  • 4
  • 2

2 4 x 10

5

Mode Shape (kg-0.5) Experimental Mode Shapes vs. Analytical Without Tip Test B1 Vacuum Test B2 Ambient Analytical No Tip 50 100 150 200 250 300 350

  • 4
  • 2

2 4 x 10

5

Mode Shape (kg-0.5) Position (μm)

slide-16
SLIDE 16

16

Tuned Analytical Model Tuned Analytical Model

Ten-term Ritz series model created of AFM cantilever including tip mass. Tip mass adjusted until the first three freqs measured in vacuum agreed closely.

50 100 150 200 250 300 350

  • 3
  • 2
  • 1

1 2 3 x 10

5

Mode Shape (kg-0.5) Experimental Mode Shapes vs. Tuned Ritz Series Model Test B1 Test B2 Model 50 100 150 200 250 300 350

  • 4
  • 2

2 4 x 10

5

Mode Shape (kg-0.5) Position (μm)

419.8 439.8 4 210.3 213.8 3 70.5 70.8 2 9.07 9.07 1 Model (kHz) Exp. (kHz) Mode #

slide-17
SLIDE 17

17

An Observation An Observation

SEM Images show that the cantilever is significantly thicker than its specification near the tip and thinner near the root. Nominal Thickness: 1 μm

slide-18
SLIDE 18

18

Estimated Calibration Errors Estimated Calibration Errors

Method of Sader overestimates area density significantly ks above assumes mode shapes are unchanged Based on tuned analytical model, error in stiffness calibration due to mismatch in the mode shapes is:

0.4%, 13% & 6% for the 1st, 2nd & 3rd Modes

respectively.

Sader (no tip) Modified Sader (nominal tip) Percent Difference (nominal tip) Modified Sader (tuned tip) Percent Difference (tuned tip) ks

0.0424 N/m 0.0424 N/m 0 % 0.0424 N/m 0 %

ρch

4.39 g/m

2

3.28 g/m

2

34% 1.90 g/m

2

130%

slide-19
SLIDE 19

19

Other Implications Other Implications

Higher modes of vibration can cause internal resonance when scanning, which may distort the results. This has also been exploited (Crittenden, Raman, Reifenberger) to improve image contrast. Yamanaka et al. image with higher harmonics directly to obtain deeper penetration into the sample. In either case tip mass should not be neglected!

spectrum on mica 1st Harmonic 7th Harmonic

slide-20
SLIDE 20

20

Conclusions Conclusions

Tip mass is a significant portion of the total effective mass of some common commercial AFM probes.

Tip changes the mode shapes and frequencies of

the 2nd and higher modes resulting in significant calibration errors if these modes are utilized.

1st mode is almost unaffected, so the cantilever

stiffness can be accurately estimated using this mode with either the Thermal Tune method or the Method of Sader.

Area density is not accurately estimated unless the

tip mass is accounted for.