Excretion Consumption = Growth + (Metabolism + SDA) + F(egestion) + - - PDF document

excretion
SMART_READER_LITE
LIVE PREVIEW

Excretion Consumption = Growth + (Metabolism + SDA) + F(egestion) + - - PDF document

Excretion Consumption = Growth + (Metabolism + SDA) + F(egestion) + U (excretion ) Energetics Processes Hormonal Control Ingestion Storage Mobilization Adsorption Excretion Lipid Lipid Renal Carbohydrate Carbohydrate Stomach


slide-1
SLIDE 1

1

Excretion

  • Consumption = Growth + (Metabolism +

SDA) + F(egestion) + U (excretion)

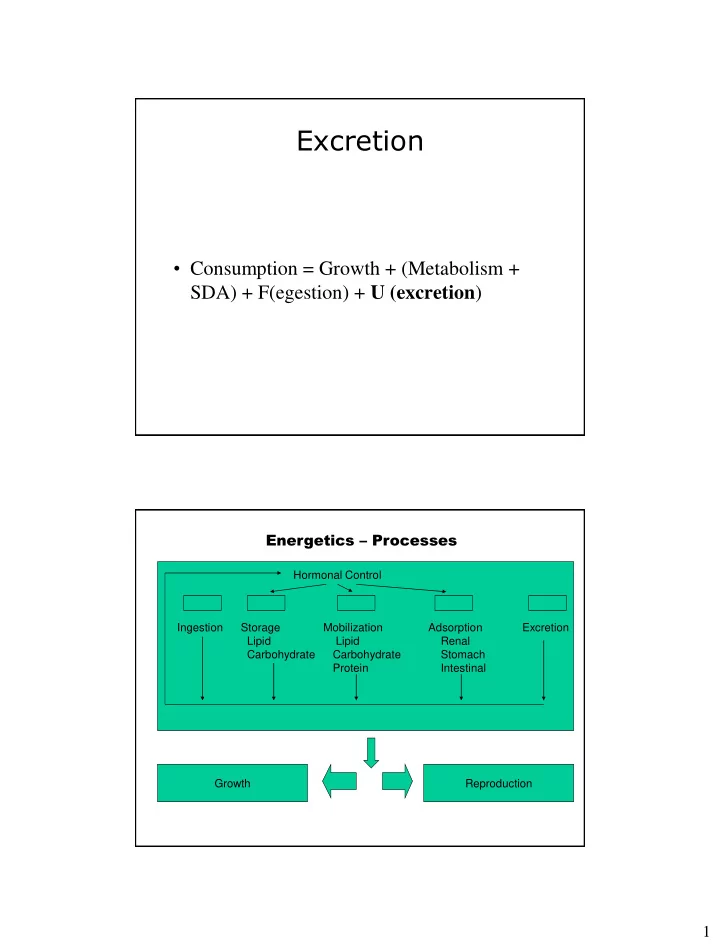
Energetics – Processes

Hormonal Control Excretion Adsorption Renal Stomach Intestinal Storage Lipid Carbohydrate Mobilization Lipid Carbohydrate Protein Ingestion Growth Reproduction

slide-2
SLIDE 2

2

Assimilated materials must be metabolized and excreted

  • Major end products are water, CO2 and

ammonia, with small amounts of urea, creatine, creatinine, and uric acid.

  • Lipids and carbohydrates are metabolized

directly to water and CO2.

  • Proteins peptides and amino acids are

deaminated to yield ammonia and carbon chain oxidized to CO2 and water.

  • Nucleic acids are primarily metabolized to

creatine and creatinine.

  • Ammonia (NH3) is major nitrogenous

waste product.

  • Salmonids fed dry diets produce 25 – 35 g
  • f ammonia per/kg feed consumed
slide-3
SLIDE 3

3

Ammonia Production

  • Ammonia excretion is bioenegetically

more efficient than urea and uric acid.

  • But ammonia is more toxic
  • Most ammonia is produced in liver,

converted to nontoxic form in blood as glutamine, and transported to gills where it diffuses rapidly into water as NH3.<25% is synthesized at gills.

NH3 + H2O ↔ NH4

+ + OH-

  • Ammonia is a gas (NH3) and ion

ammonium NH4, the sum of which is the total ammonia

  • The degree to which ammonia forms the

ammonium ion increases upon lowering the pH of the solution—

  • Temperature and salinity also affect the

proportion of NH4

+.

slide-4
SLIDE 4

4

Dissociation of Ammonia

Henderson-Hasselbalch Equation

  • % NH3  100/(1 + antilog (pKa – pH))
  • pH = pKa + log ([NH3/NH+4])
  • The pKa is high (about 9.7 at 10°C)
  • Thus little ammonia will be toxic unless

water is quite alkaline (pH >> 7)

Summary Relationships

  • The activity of aqueous ammonia also is lower at

low temperatures and higher at warm temperatures.

  • At low temperatures and low pH the activity as

NH3 is even lower, and as NH4

+ is even higher.

  • Therefore, sensitive aquatic organisms can tolerate

a higher total ―ammonium-N plus ammonia-N‖ at low temperatures than at high temperatures due to much less aqueous NH3 being present in the water.

slide-5
SLIDE 5

5

Critical Concentrations

  • Un-ionized NH3 molecules are toxic and can

cause gill damage if higher than 0.1- 0.5 mg/L

  • Amt toxic NH3 formed is function of water

pH, temperature and salinity or TDS.

  • Due to solubility restraining movement is not

easy.

% NH3 ↔ 100/(1 + antilog(pKa-pH))

  • Use charts to get an idea of this outcome
  • Ammonia perturbations can affect nerve

cell function, ion transport process, metabolism , pH.

slide-6
SLIDE 6

6

pH pH 5 5 10 10 15 15 20 20 6.0 6.0 0.01 0.01 0.02 0.02 0.03 0.03 0.04 0.04 6.4 6.4 0.03 0.03 0.05 0.05 0.07 0.07 0.10 0.10 6.8 6.8 0.08 0.08 0.12 0.12 0.17 0.17 0.25 0.25 7.0 7.0 0.1 0.13 3 0.1 0.18 8 0.2 0.27 0.4 0.40 7.2 7.2 0.20 0.20 0.29 0.29 0.43 0.43 0.63 0.63 7.4 7.4 0.32 0.32 0.47 0.47 0.69 0.69 1.0 1.0 7.6 7.6 0.50 0.50 0.74 0.74 1.08 1.08 1.60 1.60 7.8 7.8 0.79 0.79 1.16 1.16 1.71 1.71 2.45 2.45 8.0 8.0 1.24 1.24 1.83 1.83 2.68 2.68 3.83 3.83 8.2 8.2 1.96 1.96 2.87 2.87 4.18 4.18 5.93 5.93 8.4 8.4 3.07 3.07 4.47 4.47 6.47 6.47 9.09 9.09 8.6 8.6 4.78 4.78 6.90 6.90 9.88 9.88 13.68 13.68 8.8 8.8 7.3 7.36 6 10 10.51 .51 14 14.80 .80 20 20.07 .07 9.0 9.0 11.18 11.18 15.70 15.70 21.59 21.59 28.47 28.47

Freshwater % unionized ammonia by water temperatures From Wedemeyer Temperatures

Freshwater

  • Copious urine because of continuous
  • smotic influx of water.
  • Serves to dilute small amounts of ammonia

excreted by kidneys

slide-7
SLIDE 7

7

Seawater

  • Less urine produced and more ammonia

excreted through the gills

  • Sharks and rays produce urea, but as a way
  • f increasing osmolarity of body fluids to

approximately concentration seawater.

Water temperature (°C) Seawater relationship % unionized ammonia.

pH 5 10 15 20 7.2 0.17 0.24 0.35 0.51 7.4 0.26 0.38 0.56 0.81 7.6 0.42 0.60 0.88 1.27 7.8 0.66 0.95 1.39 2.00 8.0 1.04 1.49 2.19 3.13 8.2 1.63 2.34 3.43 4.88 8.4 2.56 3.66 5.32 7.52 8.6 4.00 5.68 8.18 11.41 8.8 6.20 8.72 12.38 16.96 9.0 9.48 13.15 18.29 24.45

slide-8
SLIDE 8

8

Transport

  • Some blood NH4 is exchanged by active

transport for Na+ in the water. If water pH and ammonia concentration of water are lower than blood, freshwater fish can readily excrete blood ammonia.

  • If water pH is more alkaline than blood and

dissolved ammonia concentration higher, the

  • utward flow of ammonia is hindered.

Blood Water NH3 NH4 Na+ NH4

Current Model For Transport

Active Exchange for Na

slide-9
SLIDE 9

9

Excretion

  • Most important factor affecting rate of total

nitrogen excretion is feeding

  • Gills account for 80- 95% of whole body

nitrogen excretion

  • Urea sometimes contributes and can be

more important in some cases in freshwater

Renal Excretion

  • Glomerular recruitment occurs much

as lamelar recuritment

  • Still, renal nitrogen excretion is not

used in high percentage among fishes.

slide-10
SLIDE 10

10

Osmotic and Ionic Regulation

  • Water and small non electrolytes like urea

and ammonia can move through plasma membrane at internal/external interface by moving though lipid bilayer

  • Ions such as sodium, potassium and

chloride will not pass easily across membrane without help of membrane transport proteins that span the lipid bilayer.

Extra renal epithelial tissues

  • Gills
  • Integument
  • Gut
  • Urinary bladder
  • Specific salt glands (rectal gland in

elasmobranchs)

slide-11
SLIDE 11

11

Ionic Balance - Seawater

  • Oral Ingestion. Gradient may be large.

Hyperosmotic external environment withdraws water

  • Drinking rates 3-10 X higher than in

freshwater adapted fishes.

  • Bulk of water and salt uptake is in small

intestine, following osmotically the transport of ions.

Oral

  • NaCl and water absorbed across intestine

and gut absorption is direct function of

  • smolarity to which fish has adapted.
slide-12
SLIDE 12

12

Gills & Chloride Cells

  • Chloride- secreting cell ( chloride cell)
  • Mitochondrial rich
  • Multicellular complexes
  • Model of operation

Kidney(excretory)

  • Renal corpuscle- glomerulus
  • Neck
  • Proximal segment
  • Intermediate segment
  • Distal segment
  • Collecting tubule
slide-13
SLIDE 13

13

Freshwater Filtration

  • Urine less concentrated than blood
  • Large glomeruli that filter water from blood
  • Reabsorbed from proximal tubule
  • Monovalent ions reabsorbed at both

proximal and distal tubule segments

Renal capsule Proximal Distal Segments of a Renal Tubule

slide-14
SLIDE 14

14

Seawater Filtration

  • Less urine production. Proximal

tubules long- higher metabolic cost

  • More distal part secretes divalent ions

Mg and SO4 into tubules

Fresh water Bailing out Conserving by re-sorption Sea water Reduction of exposure Removal of toxics of Mg SO4 Other wastes that can not pass branchial

slide-15
SLIDE 15

15

Diadromous Fish

  • Reproduce Freshwater – Anadromous

– Examples

  • Reproduce Seawater -

Catadromous

– examples

slide-16
SLIDE 16

16

Smoltification- Anadromous

  • Parr-smolt transformation

– Dynamic and multifactor

  • Size, time, and multifactor endocrine -physiology

– Ontogeny of salinity tolerance

  • Different for different species and life history

Term smolt

  • First used for juvenile Atlantic Salmon
  • Silvery stage
  • Annual cycle – mostly in spring but some in

autumn

  • Photoperiod control
  • Induced with short day to long days
slide-17
SLIDE 17

17

Parr smolt transformation

  • Developmental process
  • Osmoregulatory physiology
  • Growth changes
  • Energetic and metabolic changes
  • Behavioral changes

Physiology Endocrinology - Factors

  • Many components
  • Not a gold standard except actual migration

and survival

  • Many studies, lots of data from lab

evaluations- not necessarily field

  • Factors moving in different directions over

time

slide-18
SLIDE 18

18

High Interest

  • <1% all fish are diadromous most are of high

importance and value – also considered keystone species re nutrient cycles etc…..

  • Aquaculture- commercial food fish
  • Conservation aquaculture for stock restoration and

supplementations

  • Management of river and hydrosystems for

downstream passage and adequate environmental conditions

  • Concern about Xenobiotics and other toxicants in

waterways

Pacific salmonids and SH

  • Amago
  • Masu
  • Coho
  • Sockeye +
  • Chinook +
  • Chum
  • Pink
  • Steelhead

++ ++

not all go

Winters in FW as Juv. Duration 1 2 in SW

++ 4-5 mo ++ + 1 yr ++ + 0.5-1 yr + ++ + 1 – 3 yr ++ ++ + 1-3 yr ++ 1-4 yr ++ 1 yr

slide-19
SLIDE 19

19

Review of adaptations FW

  • Gills – absorption Na and Cl
  • Intestine – reduced fluid uptake
  • Kidney – high volume, absorption Na and

Cl

Adaptation SW

  • Gill – Excretion Na and Cl & Reduced

permeability to Water

  • Intestine – Absorption fluids, absorption Na

and Cl

  • Kidney – Low volume, excretion of Mg++

e.g. divalent ions

slide-20
SLIDE 20

20

Bridging the Gap

  • Transition into seawater
  • Do fish go only when ready?
  • What controls migration rates
  • What size and time to release smolts?

Na K gill ATPase

  • Increases after transfer to seawater
  • Ionic gradients generated by enzyme
  • Mitochondrial rich chloride cells
  • Chloride cells increase in number
  • Na flux changes from net influx to net

efflux

slide-21
SLIDE 21

21

Intestinal net fluid flux

  • Increased absorption of water

Hormonal Controls

  • Thyroid - was highly researched

– Usually a distinct peak in plasma thyroxine – Influences behavior, growth, and morphological development

slide-22
SLIDE 22

22

Prolactin and Growth Hormone Adenohypophysis

  • Prolactin implicated to increase tolerance to

seawater

  • Plasma Insulin like growth hormone (IGF)

can influence survival and osmoregulation

  • Likely growth hormone secreted at greater

rate in seawater

Cortisol

  • Considered important promoter of

adaptation to seawater

  • Receptor with affinity for cortisol identified

in gill tissues.

slide-23
SLIDE 23

23

Others

  • Methyl testosterone can inhibit smolting
  • Corpuscles of Stannius
  • Calcitonin
  • Catecholamines- adrenaline

– Chloride secretions inhibited

Migratory behavior Salinity tolerance Salinity preference Body silvering Growth rate Condition factor Oxygen consumption Ammonia production Liver glycogen Smolt Development – changes up or down

slide-24
SLIDE 24

24

Migratory behavior Salinity tolerance Salinity preference Body silvering Growth rate Condition factor Oxygen consumption Ammonia production Liver glycogen Smolt Development – changes up or down Blood glucose Growth hormone Corticosteroids Thyroxine Prolactin Gill ATPase Smolt Development – changes up or down

slide-25
SLIDE 25

25

Blood glucose Growth hormone Corticosteroids Thyroxine Prolactin Gill ATPase

Smolt Development – changes up or down

slide-26
SLIDE 26

26

Return Spawning Migrations

what controls that portion of the life history?

  • Precociously mature physiology

– Masu – Sockeye – Chinook

Blood Plasma Analyses Used to Characterize Steelhead Kelts

Nutritional Factors (Energy Reserves and Fitness)

Cholesterol, Calcium, Alkaline Phosphatase (ALP), Triglycerides, Amylase, Lipase, Glucose, and Phosphorus

Tissue Damage Factors (External / Internal Damage)

Alanine Aminotransferase (ALT), Aspartate Aminotransferase (AST), and Lactate Dehydrogenase (LDH)

Electrolytes (Osmoregulation)

Sodium, Chloride, Potassium, and Magnesium

Hormone Factors

T4 – Thyroid Function Cortisol - Stress

slide-27
SLIDE 27

27

Is a Kelt a Smolt?

Na+K+Gill ATPase is Elevated in Smolts During Migration Thyroxin Hormone T4 is Elevated in Smolts and Initiates Silvering and Migration

Chloride

Good Fair Poor Chloride (mmol/L)

60 80 100 120 140 160 180

Glucose

Good Fair Poor Glucose (mg/dL)

50 100 150 200 250

Thyroxin

Good Fair Poor Thyroxin (ng/mL)

10 20 30 40

Sodium

Good Fair Poor Sodium (mmol/L)

80 100 120 140 160 180 200

Migrating kelts at LGD- preparation for seawater

slide-28
SLIDE 28

28

Na+K+ ATPase Activity

0.0 0.5 1.0 1.5 2.0 2.5 3.0 3.5 4.0

2009 2010

Na K – ATPase of good condition kelts at Lower Granite Dam

Kelts and Mature Steelhead Gill Na+K+ -ATPase activity

0.0 0.5 1.0 1.5 2.0 2.5 3.0

Sodium (mmoles/L)

90 100 110 120 130 140 150 160 170 180 190 200

Fair Good Poor Mature

2010 Good Condition Fish

slide-29
SLIDE 29

29

Mature vs. Good Condition Kelts

Thyroxine ng/mL 5 10 15 20 25 30 Mature Silver Kelts