SLIDE 1
Equivalents Work with a partner. Try writing the - - PowerPoint PPT Presentation
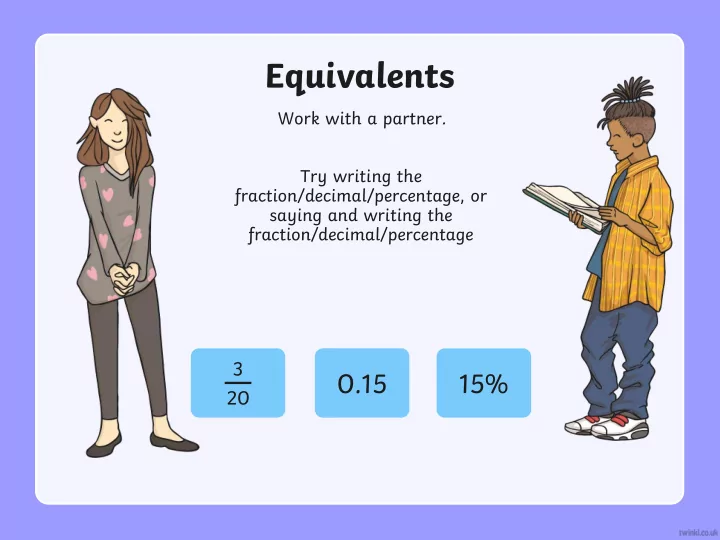
Equivalents Work with a partner. Try writing the fraction/decimal/percentage, or saying and writing the fraction/decimal/percentage 3 0.15 15% 20 One Decimal Place Match the equivalent fractions, decimals and percentages. 3 1 25% 0.3
SLIDE 2
SLIDE 3
Aleena and Haris each have a pizza. Aleena eats 60% of her pizza. Haris eats ¾ of his pizza. Who eats more pizza? How do you know? Create your own word problem comparing two different amounts using fractions and percentages.
Pizza
Show Answers Hide Answers
Aleena eats 60% of her pizza. Haris eats ¾ of his pizza. Who has eaten more? Show as a fraction, deimal and a percentage.
SLIDE 4
Order
Order each row smallest to largest: Write some of your own fractions/percentages.
- f 64
30% of 90 50 × 0.6
1 2
75% of 80 140 × 0.4
- f 96
2 3
68 x 0.25
- f 24
- f 100
3 20 3 4
- f 60
0.1 x 500 60% of 90
4 5
- f 100=
3 20
- f 64 =
30% of 90 =
50 × 0.6 =
1 2 75% of 80 =
140 × 0.4=
- f 96 =
2 3
68 x 0.25 =
- f 24 =
3 4
- f 60 =
0.1 x 500=
60% of 90 = 4 5
Show Answers
SLIDE 5
Visual Representation
Write the fraction, decimal and percentage represented by these shapes: Draw some of your own representations. = 0.52 = ?%
13 25
= 0.84 = ?%
21 25