Energy Ventures Analysis 1901 N. Moore St. Arlington, VA 22209 - - PowerPoint PPT Presentation

energy ventures analysis
SMART_READER_LITE
LIVE PREVIEW

Energy Ventures Analysis 1901 N. Moore St. Arlington, VA 22209 - - PowerPoint PPT Presentation

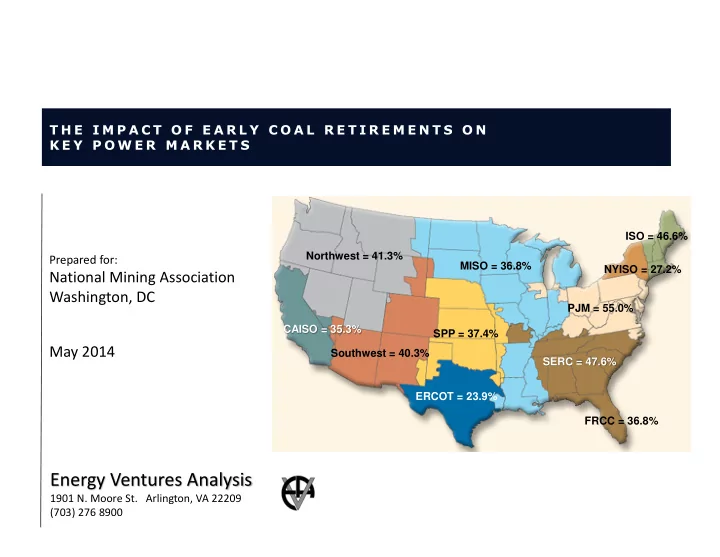
T H E I M P A C T O F E A R L Y C O A L R E T I R E M E N T S O N K E Y P O W E R M A R K E T S ISO = 46.6% Northwest = 41.3% Prepared for: MISO = 36.8% NYISO = 27.2% National Mining Association Washington, DC PJM = 55.0% CAISO =


slide-1
SLIDE 1

Energy Ventures Analysis

1901 N. Moore St. Arlington, VA 22209 (703) 276 8900

T H E I M P A C T O F E A R L Y C O A L R E T I R E M E N T S O N K E Y P O W E R M A R K E T S

May 2014

Prepared for:

National Mining Association Washington, DC

MISO = 36.8% CAISO = 35.3% ERCOT = 23.9% ISO = 46.6% PJM = 55.0% SERC = 47.6% FRCC = 36.8% NYISO = 27.2% SPP = 37.4% Southwest = 40.3% Northwest = 41.3%

slide-2
SLIDE 2

1 OUTLINE

Problem Statement

Introduction

Impact of Early Coal Retirements in Winter

Impact of Early Coal Retirements in Summer

Methodology

Detailed Gas Analysis

Detailed Power Analysis

Appendix

E N E R G Y V E N T U R E S A N A L Y S I S , I N C .

slide-3
SLIDE 3

2 PROBLEM STATEMENT

The winter of 2013-14 posed a large challenge to the power and natural gas markets. The U.S. had its 11th coldest winter in history, record high natural gas demand and average peak power prices that were more than double than what has been

  • bserved in the past 5-years. Additionally, the market witnessed record high gas storage withdrawals, and short term gas

price spikes reaching as high as $135/MMBtu at some Northeast trading points. Across the Eastern U.S there was simultaneously strong demand for electricity and natural gas to heat homes and

  • businesses. Every bit of natural gas in storage and every electricity generation asset was needed to meet demand. However,

there were gas supply constraints in particular areas and some generation assets were unable to perform as expected because of the frigid temperatures. Because of these situations, coal-fired assets were relied upon heavily to provide dependable electricity across the region. EPA’s Mercury and Air Toxics standards will force 26 gigawatts of coal capacity to exit the power markets between the latter half of 2014 and 2016. The majority of the these coal-fired retirements will occur in the regions where they were relied upon to provide electricity this past winter (New England, East North Central, Middle Atlantic, South Atlantic, East South Central). If these coal-fired plants were not available during the winter of 2014, there would have been severe reliability issues within key electric power markets, because of the constraints in natural gas supply and power generation outages. Additionally, the seasonal spikes in regional natural gas prices that occur, would have been even greater than what was experienced this past winter, causing average peak electricity prices to surge more than 40 percent more than what was

  • bserved.

The purpose of this study is to examine the impact to the power and natural gas markets if the coal-fired assets that will retire in the 2014-2016 period had not been available for the winter of 2014. Additionally, if these coal-fired assets were not available during a hot summer, this study analyzes how the power and natural gas markets would be impacted.

E N E R G Y V E N T U R E S A N A L Y S I S , I N C .

slide-4
SLIDE 4

3 INTRODUCTION

E N E R G Y V E N T U R E S A N A L Y S I S , I N C .

EVA identified the power markets having the greatest power reliability risk from the retiring coal units from the change in their reserve margins and fuel delivery constraints.

Reliability assessment to focus on PJM, MISO and ISO-NE.

PJM, because it has the most coal-fired retirements and its reserve margin dropping to only 5%-- well below the 15% target

MISO because it has a large amount of coal retirements and reserve margin falls bellow its 15% target

ISO-NE because the region is at risk for reliability during periods of constrained gas supply. At critical junctures,

  • nly 3,500 MW of ISO-NE’s 18,000 MW gas-fired

capacity was available this winter because of gas constraints.

The coal retirements also have an impact on SERC’s and SPP’s reserve margins, but even after the retirements, these regions have sufficient surplus capacity remaining to remain above reserve margin targets

POWER MARKET RESERVE MARGIN SUMMARY PRE and POST COAL RETIREMENTS

Region Demand Diff.

ISONE 32,631 26,505 23% 1,500 17%

  • 6%

NYISO 35,000 29,971 17% 75 17% 0% PJM 180,000 160,000 13% 11,646 5%

  • 7%

SERC 175,053 135,666 29% 10,614 21%

  • 8%

FRCC 50,000 43,288 16% 16% 0% MISO 103,945 87,578 19% 4,700 13%

  • 5%

ERCOT 78,000 67,000 16% 16% 0% SPP 56,326 36,729 53% 1,970 48%

  • 5%

CAISO 55,000 46,000 20% 101 19% 0%

Base Capability Base Reserve Post Retire Reserve Retiring Coal Capacity

slide-5
SLIDE 5

4 INTRODUCTION

In order to systematically and correctly evaluate the issues laid out in the problem statement, EVA designed three sets

  • f scenarios for both the winter and summer reliability assessment (see table below)

For each scenario, EVA analyzed the PJM, MISO and ISO-NE power markets

For the ISO-NE winter scenarios, EVA modified its business process from the other two power markets. EVA selectively restricted gas-fired generation assets in ISO-NE that are connected to the Algonquin pipeline, as they were unable to

  • perate during the 2014 winter because of constrained gas supply.

REVIEW OF SCENARIOS PERFORMED

Winter Assessment Base Case - Wint. Re-Simulation of natural gas and power markets in Winter 2014 (Jan-Feb) Case #1 Base Case - Wint. minus 2014 to 2015 MATS related coal retirements Case #2 Base Case - Wint. minus 2014 to 2016 MATS related coal retirements Summer Assessment Base Case - Sum. Simulation of natural gas and power markets for extreme summer weather in 2014 (June- Aug) Case #3 Base Case Sum. minus 2014 to 2015 MATS related coal retirements Case #4 Base Case Sum. minus 2014 to 2016 MATS related coal retirements

E N E R G Y V E N T U R E S A N A L Y S I S , I N C .

slide-6
SLIDE 6

5 IMPACT OF COAL RETIREMENTS ON SYSTEM RELIABILITY - WINTER

E N E R G Y V E N T U R E S A N A L Y S I S , I N C .

PJM

During this past winter, record high electricity demand and generation outages led to several instances in which PJM was low on resources and narrowly avoided load shedding to maintain system reliability

If the coal plants scheduled to be retired from 2014 to 2016 were not available in PJM during the winter of 2014, there would have been 34 hours where the reserve margin was less than 5% and 4 hours where there would have been a negative reserve margin (insufficient supply) and would have forced power curtailments MISO

In MISO, despite record high demand due to sustained cold weather, the reserve margin did not become precariously tight

Under EVA’s scenario analysis, no real reliability issues were predicted if the retiring coal plants were not available during the winter of 2014. EVA only estimated 2 hours where there would have been a reserve margin between 5% and 10%

NUMBER OF HOURS IN JANUARY 2014 BELOW KEY RESERVE MARGIN LEVELS

<10% <5% <0%

Base Case

2

2014-15 Retirement

30 16 16

2014-16 Retirement

30 16 16

Base Case

16

2014-15 Retirement

57 31 3

2014-16 Retirement

55 34 4

Base Case 2014-15 Retirement

1

2014-16 Retirement

2 ISO-NE PJM MISO Reserve Margin ISO-NE

In ISO-NE, select gas-fired generators were unable to perform as expected as natural gas pipeline capacity in the Northeast was constrained.

The reserve margin for ISO-NE would have been negative for 16 hours in January 2014 (without the coal capacity that is expected to retire over the next two years) and would have forced power curtailments.

slide-7
SLIDE 7

6 IMPACT OF COAL RETIREMENTS ON WINTER POWER PRICES (JANUARY-FEBRUARY 2014)

 In

addition to threatening system reliability, early coal retirements drove higher wholesale power prices in all three markets, though the impact in PJM in ISO- NE was greater

 The table to right illustrates what the

average wholesale power price would have potentially been in January-February 2014, if the coal plants scheduled to retired would not have been available.

 PJM wholesale prices would have been

40% greater without the coal plants, while ISO-NE wholesale prices 50% greater.

 The detailed power analysis section of this

report will provide more color on how the power prices would have been effected in the absence of the coal plants

  • AVG. WHOLESALE POWER PRICE FOR EACH WINTER SCENARIO ($/MWh)

ISO-NE $120 $180 $180 PJM $102 $143 $145 MISO $41 $58 $60

B as e Cas e 2014-15 Retirements 2014-16 Retirements E N E R G Y V E N T U R E S A N A L Y S I S , I N C .

slide-8
SLIDE 8

7 IMPACT OF COAL RETIREMENTS ON WINTER POWER PRICES – JANUARY 2014

Although the majority of coal retirements affect the Eastern U.S. power markets (PJM, MISO and ISO-NE ) the most, the resulting increase in gas demand leads to a rise in the national natural gas prices.

The table to the left illustrates the effects of the increased price in natural gas on wholesale power prices in other US power markets.

For example, the California power market, CAISO, would have experienced a 35% power price increase if the coal-fired facilities were retired prior to this past winter.

AVERAGE MONTHLY POWER PRICES – MAJOR U.S. MARKET REGIONS

Region

ISONE $130 $190 46.6% NYISO $120 $152 27.2% PJM $103 $159 55.0% SERC $56 $83 47.6% FRCC $41 $56 36.8% MISO $39 $53 36.8% ERCOT $67 $83 23.9% SPP $38 $53 37.4% CAISO $50 $68 35.3%

Base Power Prices Power Prices with Retirements % Change E N E R G Y V E N T U R E S A N A L Y S I S , I N C .

slide-9
SLIDE 9

8

E N E R G Y V E N T U R E S A N A L Y S I S , I N C .

MISO = 36.8%

IMPACT OF COAL PLANT RETIREMENTS ON WINTER POWER PRICES – JAN-FEB 2014

CAISO = 35.3% ERCOT = 23.9% ISO = 46.6% PJM = 55.0% SERC = 47.6% FRCC = 36.8% NYISO = 27.2% SPP = 37.4% Southwest = 40.3% Northwest = 41.3%

slide-10
SLIDE 10

9 IMPACT OF COAL RETIREMENTS ON POWER GENERATION

Of the total Base Case coal generation in January 2014, 92% came from remaining units while 8% came from units slated for retirement.

With the early retirements, coal’s 8% was replaced with three-fourths natural gas and one- fourth incremental coal generation along with a small amount (0.01%) of Demand Side Curtailment.

ESTIMATED REPLACEMENT GENERATION FOR RETIRED COAL GEN. FOR JANUARY 2014

E N E R G Y V E N T U R E S A N A L Y S I S , I N C .

slide-11
SLIDE 11

1 0 IMPACT OF COAL RETIREMENTS ON GAS INDUSTRY - WINTER

Even without the projected coal retirements, the gas industry was at a precipice.

Record demand, storage withdrawal, prices etc.

Pipeline, LDCs and storage operators restrict supplies to non-firm customers.

Gas-fired generating capacity lost in several regions due to curtailment of gas supplies.

Near record low storage inventories at the end of winter leave industry with a challenge to refill storage to adequate levels.

With the project coal retirements, the conditions for the gas industry would have been worse

Winter Assessment

  • Records for demand, storage withdrawals and prices would have been reset to higher levels.
  • Additional pipeline, LDC and storage operator curtailments likely would have occurred.
  • More power plants likely would have had gas supplies curtailed.

In NEPOOL it is unlikely pipeline capacity would have been adequate.

  • As a result NEPOOL would have been faced with selecting from the following alternatives:
  • Increase oil-fired generation (i.e., an additional 1.8 MM barrels).
  • However, NEPOOL outstripped its capability to resupply fuel oil in January in the base case.
  • Increase imported power.
  • Difficult to determine which neighboring regions would have additional power to export.
  • Commence with load shedding.
  • Impact on other regions would not have been as severe as those for NEPOOL.
  • However, curtailment of gas supplies for an additional power plants would be likely.
  • Additional cost to consumers for winter supplies would have been about $35 billion.

E N E R G Y V E N T U R E S A N A L Y S I S , I N C .

slide-12
SLIDE 12

1 1 IMPACT OF COAL RETIREMENTS ON SYSTEM RELIABILITY – SUMMER- JULY 2014

To gauge the impact of these coal retirements during a warmer than normal summer period, EVA created a high demand scenario based upon historical data during peak summer months PJM

In PJM, EVA found that the early retirement of this coal capacity could lead to 35 hours of reserve margins below 0% based on installed capacity

PJM reports having over 10 GW of demand response capability that can mitigate the risk of blackouts, but in some instances the shortage would be greater than 10 GW.

Additionally, demand response resources are only required to perform up to 10 times each year. MISO

In MISO, 31 hours were found to have reserve margins below 0% based on installed capacity, while 68 hours had reserve margins below 5%

E N E R G Y V E N T U R E S A N A L Y S I S , I N C .

ISO-NE

In ISO-NE, capacity shortages exist in all cases due to the high summer demand and the loss of retired coal plants

With the loss of Salem Harbor and Brayton Point, New England likely would need to rely on either Demand Response, increased imports, or more oil-fired generation to meet peak load <10% <5% <0%

Base Case

16 25 25

2014-15 Retirement

8 17 17

2014-16 Retirement

11 22 22

Base Case

27 16 5

2014-15 Retirement

57 32 34

2014-16 Retirement

58 34 35

Base Case

69 34 4

2014-15 Retirement

60 71 18

2014-16 Retirement

71 68 31 Reserve Margin ISO-NE PJM MISO

NUMBER OF HOURS IN JULY 2014 BELOW KEY RESERVE MARGIN LEVELS

slide-13
SLIDE 13

1 2 IMPACT OF COAL RETIREMENTS ON POWER PRICES – SUMMER- JUNE-AUGUST

EVA estimated the effects of extreme summer weather without the coal plants on wholesale power prices during June-

  • August. The results are summarized in the

table to the left. A more detailed summary

  • f the effects are presents in the detail

power analysis section. PJM

Price impacts in PJM are significant during the summer as higher heat rate units and demand response are called upon to meet load

Wholesale power prices in PJM are estimated to increase 33% in an extreme summer without the coal units MISO

In MISO, the price impact is more muted due to fewer retirements and a healthier reserve margin

EVA estimates that the average wholesale power price for MISO would increase 8% without the coal plants

  • AVG. WHOLESALE POWER PRICE FOR EACH SUMMER SCENARIO ($/MWh)

ISO-NE $55 $69 $70 PJM $49 $64 $65 MISO $39 $42 $42

B as e Cas e 2014-15 Retirements 2014-16 Retirements

ISO-NE

The prices in the Base case are driven up due to the high demand during the hot summer. With summer peaks approaching the available capacity in New England, the power prices are dictated by the high cost marginal resources in the region

Without the coal plants and the extreme warm weather, ISO-NE power prices increase 27% compared to the base case.

EVA did not assume any constrained gas-fired capacity in ISO-NE for the summer scenarios

E N E R G Y V E N T U R E S A N A L Y S I S , I N C .

slide-14
SLIDE 14

1 3 IMPACT OF COAL RETIREMENTS ON POWER PRICES – JULY 2014

The high withdrawal of natural gas during the winter resulted in storage depletion and lower summer gas storage inventory

This caused natural gas prices to rise during the summer resulting in higher power prices in EVA’s Base Case

With the coal units not available to provide base load power needs, more gas units are at the margin, which drives up the power prices in PJM, MISO, ISO-NE and SPP

NYISO is a gas-dominated region that experiences winter basis blowouts which drive much higher prices in the retirement cases

AVERAGE MONTHLY WHOLESALE POWER PRICES – MAJOR U.S. MARKET REGIONS Region

ISONE $74 $106 43.7% NYISO $69 $104 49.9% PJM $63 $97 54.5% SERC $42 $45 8.8% FRCC $45 $48 7.0% MISO $41 $45 10.4% ERCOT $41 $44 6.4% SPP $40 $44 10.6% CAISO $49 $52 6.3%

Base Power Prices Power Prices with Retirements % Change

E N E R G Y V E N T U R E S A N A L Y S I S , I N C .

slide-15
SLIDE 15

1 4 IMPACT OF COAL RETIREMENTS ON POWER GENERATION - SUMMER

E N E R G Y V E N T U R E S A N A L Y S I S , I N C .

In the summer, the Base Case mix was the same: 92% from remaining units and 8% from retiring units.

When the early retirements kick in, coal again supplies one-fourth of the replaced generation while gas accounts for roughly 6.5%.

10 times the amount of Demand Side Curtailment is required in the summer.

ESTIMATED REPLACEMENT GENERATION FOR RETIRED COAL GENENERATION FOR JULY 2014

slide-16
SLIDE 16

1 5 IMPACT OF COAL RETIREMENTS ON GAS INDUSTRY - SUMMER

The winter impact would have resulted in record low storage levels at the beginning of spring (April 1, 2014).

STORAGE LEVELS AT THE END OF WINTER (MARCH 31)

965 1,332 757 977 1,138 1,403 1,153 738 1,497 693 1,028 1,249 1,695 1,572 1,242 1,665 1,660 1,577 2,473 1,723

500 1,000 1,500 2,000 2,500 3,000 1994 1995 1996 1997 1998 1999 2000 2001 2002 2003 2004 2005 2006 2007 2008 2009 2010 2011 2012 2013

(BCF)

Historical 820 590 545

W/O Coal Retirements With Coal Retirements (14/15) With Coal Retirements (14/15/16)

With Coal Retirements (14/15/16) Without Coal Retirements With Coal Retirements (14/15)

Forecasted for March 31, 2014

E N E R G Y V E N T U R E S A N A L Y S I S , I N C .

slide-17
SLIDE 17

1 6 IMPACT OF COAL RETIREMENTS ON GAS INDUSTRY - SUMMER

Storage injections would have been reduced to about 10.4 BCFD because additional summer gas demand.

Storage refill for next winter likely would have been inadequate unless the winter of 2014/2015 is very mild.

A supply response likely would occur.

However, it would have a minimal impact on 2014 storage injections.

  • Nonetheless, the increased supply would help meet demand during the winter of 2014/2015.

Higher gas prices would be required for a supply response.

  • Cost to consumer because of higher gas prices would be in between $11 and $59 billion depending upon

timeframe.

Total cost to consumers for winter and summer impacts could reach about $90 billion(1).

STORAGE LEVELS AT THE BEGINNING OF WINTER 2014/15

3,071 2,987 2,788 2,886 3,185 3,068 2,713 3,132 3,172 3,155 3,302 3,194 3,452 3,565 3,390 3,810 3,861 3,804 3,929 3,816

500 1,000 1,500 2,000 2,500 3,000 3,500 4,000 4,500 1994 1995 1996 1997 1998 1999 2000 2001 2002 2003 2004 2005 2006 2007 2008 2009 2010 2011 2012 2013 (BCF)

Historical 3,380 2,765 2,645

W/O Coal Retirements With Coal Retirements (14/15) With Coal Retirements (14/15/16)

With Coal Retirements (14/15/16) Without Coal Retirements With Coal Retirements (14/15)

Forecasted for 2014 (Cold Winter Plus Hot Summer)

STORAGE LEVELS AT THE BEGINNING OF WINTER (NOVERMBER 1)

E N E R G Y V E N T U R E S A N A L Y S I S , I N C .

(1) Total cost to all consumers for both gas and power is approximately $100 billion.

slide-18
SLIDE 18

1 7 CONCLUSIONS

E N E R G Y V E N T U R E S A N A L Y S I S , I N C .

Potential capacity shortages in PJM and ISO-NE during winter due to the early coal retirements.

Potential capacity shortages in PJM, MISO and ISO-NE during a hot summer due to high demand and early coal retirements.

High wholesale power prices during both winter and summer months resulting in a potential addition of $35 billion to the energy costs of consumers in 2014.

POWER MARKET CONCLUSIONS

slide-19
SLIDE 19

1 8 CONCLUSIONS

E N E R G Y V E N T U R E S A N A L Y S I S , I N C .

Without projected retirements gas industry already at a precipice.

Pipelines, LDCs and storage operators restrict supplies to non-firm customers.

Gas-fired generating capacity lost in several regions due to curtailment of gas supplies.

Near record low storage inventories at the end of winter leave industry with a challenge to refill storage to adequate levels.

With projected retirements

Winter

  • Records for demand, storage withdrawals and prices would have been reset to higher levels.
  • Additional pipeline, LDC, and storage operator curtailments likely would have occurred.
  • More power plants likely would have had gas supplies curtailed.
  • Inadequate pipeline capacity in NEPOOL.
  • Alternatives for either increased oil-fired generation or imported power would have been unlikely.
  • Remaining alternative is to curtail electricity demand.

Summer

  • Storage levels at the start of next winter (Nov 1, 2014) at unprecedented low levels and likely inadequate,

except in the case of a mild winter.

  • Higher gas prices on a sustained basis.

Total cost to consumers for all sectors for 2014 is approximately $70 billion, and for the period 2014-2016 is $100 billion.

NATURAL GAS MARKET CONCLUSIONS