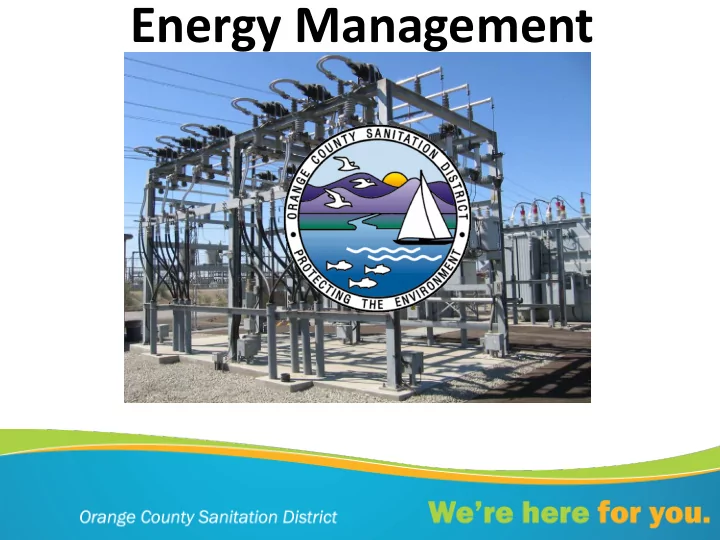

Energy Management
OCSD Service Area Orange 572 miles of sewers County 471 square miles La Habra 200 million gallons per day Brea 2.5 million population Fullerton Placentia Yorba Linda 20 cities, 4 special districts Buena Park 15 pumping stations Anaheim La Palma Anaheim 2 treatment plants Cypress Villa Park Stanton Los Orange Alamitos Garden Grove Westminster Seal Beach Santa Ana Tustin Fountain Valley Huntington Beach Costa Reclamation Mesa Plant No. 1 Irvine Newport Pacific Treatment Beach Ocean Plant No. 2 Ocean Pipeline
Water Resource Recovery Primary Secondary Preliminary Treatment Treatment Treatment Reclaim/ Influent Effluent Solids Digester Gas Processing Energy to Plant Heat Solids Solids Central Power Digesters Reuse Dewatering Generation System Engines
24.0 22.0 20.0 Total Generation 18.0 MW 16.0 Estimated 14.0 Generation 12.0 Total Plant Load 10.0 Estimated Plant 8.0 Load 2005 2006 2007 2008 2009 2010 2011 2012 2013 2014 2015 2016 2017 2018
1,100 1,300 1,500 1,700 1,900 2,100 2,300 500 700 900 Jul' 05 Oct Jan'06 Apr Jul' 06 Oct Jan'07 Apr Jul' 07 Oct Jan'08 Apr Jul' 08 Total Influent Power Efficiency (kWh/MGD) Oct Jan'09 Apr Jul' 09 Oct Jan'10 Apr Jul'10 Oct Jan'11 Apr Jul'11 Oct Jan'12 Apr Jul'12 Oct Jan'13 Apr Jul'13 Oct Jan'14 Apr P2 Energy Efficiency P1 Energy Efficiency
Industry’s Best Practices • Know how energy is being used Know what you are paying • • Understand the onsite energy generation • Build efficiency into new projects • Participate in Edison (SCE) efficiency programs • Monitor alternative energy opportunities
Energy Utilization Power Monitoring System at Each Plant • Monthly electric, gas and heat data collected and analyzed • Energy used by each process is estimated annually • Used for cost allocations and economic analyses of alternate processes • Used as baseline for efficiency projects
Energy Utilization Power Monitoring (cont’d) System at Each Plant • Identifies opportunities for energy savings • Energy info is made available to Operations staff to optimize use • Time of day price variations • Impact of taking equipment out of service
Know What You Are Paying Bills are Analyzed for Accuracy • Credit for $25 K (SCE meter failure) • SCE credit for $73,000 for standby tariff appeal • We understand the tariffs / energy markets Operation during Peak hours • • Meet with utility reps quarterly
Onsite Energy Management Produce 11 MW of Electricity Recover 1.3 M Therms Heat Saved Electricity $ 483,000 Natural Gas $ 510,000 $ 993,000 Annually
J-111 Project: Cengen Engines Emissions Reduction 2-Step Catalytic System Chemical Injection Digester Gas NOx Treatment Removal CO Catalyst Removal Catalyst
Build Efficiency into New Projects • Ultra Premium efficiency motors • Use of variable speed motor controllers • High efficiency lighting including LED • Multi-level lighting • Optimize pumping & blower applications to maximize efficiency
Participate in SCE Efficiency Programs • Savings by design $193,000 received for three projects • SCE Pump testing and optimization program • Energy conservation review - Currently TEN (The Energy Network) and Lincus
Alternative Energy Opportunities Digester Gas as Renewable Fuel • AB32 implementation - GHG emissions reduced to 1990 levels by 2020 • Use gas, get credits for renewable energy • Clean and sell gas • Sell renewable energy credits • DG export requires Natural Gas to heat digesters to produce DG
Alternative Energy Opportunities Solar Energy • Limited availability of open land and roof space – 1 megawatt requires 5 acres • Cost and benefit – 1 megawatt = $5 million, payback 15 years – Power purchase agreements are “Net Metered” – Variable output based on season & weather – Energy Storage coming into use
Alternative Energy Opportunities Fuel Cells • Emerging technology • Low emissions • High cost 1 MW = $5.2 million + $300K / yr • More electrical efficiency than engines; less heat output means boiler heat required for digesters • Should be constant-loaded; abrupt load changes & shutdowns shorten cell life
Renewable H 2 Energy Station Treatment Plant Heat (future) Power Biogas Fuel Heat Cell Solids (Future) Treatme Hydrogen nt Fueling Station Efficiency: Digesters • Target (electricity + H 2 ) 50% Natural gas • Measured (electricity + H 2 ) 53.2% (backup) (July 2011) • Measured (incl. heat value) >70%
What’s In The Future • Digestion alternatives • Increase gas production – Technology: Cambi, aquacritox, and others – Supplemental fuels • Monitor fuel cell and solar advancements
Partnerships Matter • Federal/state government – DOE, USBR, EPA, DWR, CARB, and OCWD • Private sector • Utilities
Questions? Umesh Murthy Orange County Sanitation District
Recommend
More recommend