Endpoints of Resuscitation for Endpoints of Resuscitation for - - PDF document

endpoints of resuscitation for endpoints of resuscitation
SMART_READER_LITE
LIVE PREVIEW

Endpoints of Resuscitation for Endpoints of Resuscitation for - - PDF document

Endpoints of Resuscitation for Endpoints of Resuscitation for Circulatory Shock: Circulatory Shock: When Enough is Enough? When Enough is Enough? Emanuel P. Rivers, MD, MPH, IOM Vice Chairman and Research Director Departments of Emergency


slide-1
SLIDE 1

1

Endpoints of Resuscitation for Endpoints of Resuscitation for Circulatory Shock: Circulatory Shock: When Enough is Enough? When Enough is Enough?

Emanuel P. Rivers, MD, MPH, IOM Vice Chairman and Research Director Departments of Emergency Medicine and Surgery Henry Ford Hospital Detroit, Michigan erivers1@hfhs.org

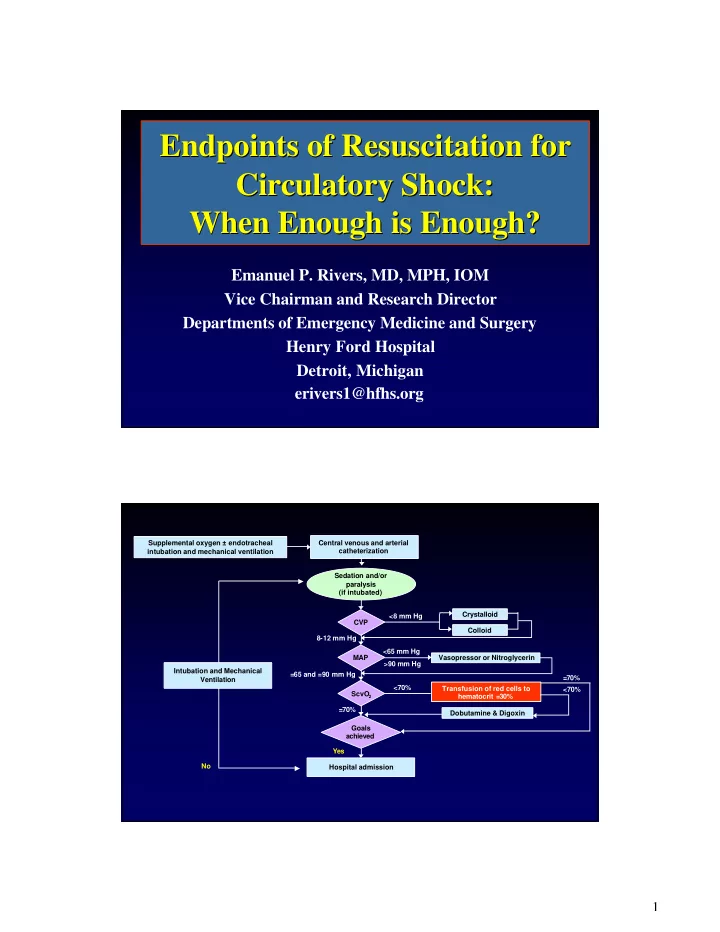
Supplemental oxygen ± endotracheal intubation and mechanical ventilation Central venous and arterial catheterization CVP Crystalloid Colloid <8 mm Hg MAP 8-12 mm Hg Vasopressor or Nitroglycerin <65 mm Hg >90 mm Hg ScvO

2

=65 and =90 mm Hg Goals achieved =70% Hospital admission Yes No Sedation and/or paralysis (if intubated) Transfusion of red cells to hematocrit =30% <70% Dobutamine & Digoxin <70% =70% Intubation and Mechanical Ventilation

slide-2
SLIDE 2

2

Communication Avoids Misunderstanding and Prevents Problems

Increased Metabolic Demands: Fever, Tachypnea Hypovolemia,Vasodilation & Myocardial Depression Microvascular Alterations: Impaired Tissue Oxygen Utilization

Inflammatory Mediators Produce Cardiovascular Insufficiency Cytopathic Tissue Hypoxia

Fink, Crit Care Clin, 2002

slide-3
SLIDE 3

3

The Purpose of Resuscitation “Perhaps Forgotten”

VO2 VO2 DO2 Critical DO2 Delivery Dependent

G l

  • b

a l t i s s u e h y p

  • x

i a Optimum region

Delivery Independent

The Problem

  • Uniformity of terminology
  • Uniformity of goals
  • Under-resuscitation
  • Over-resuscitation
  • Multiple outcome

measures in clinical trials

  • How do we solve the

problem?

Endpoints and Tools

O2 ATP Glucose

Substrates Endpoints of Resuscitation

Lactate

Happy Cell

Base Deficit (a-v)CO2 SvO

2

pHi DO2 Mediators

Goal Directed Optimization of Cardiac Function

DO2

  • PaO2
  • Hemoglobin
  • Cardiac Output

Hemodynamic

  • Preload (CVP, PCWP)
  • Afterload (MAP, SVR)
  • Contractility (SV)
  • Heart Rate (BPM)
  • Shock Index (HR/SBP)
  • Coronary Perfusion Pressure

Microcirculation

VO2

  • Stress
  • Pain
  • Hyperthermia
  • Shivering
  • Work of breathing
slide-4
SLIDE 4

4

Macro Endpoints

VO2

VO2 DO2 Critical DO2

Delivery Dependent Delivery Independent

G l

  • b

a l t i s s u e h y p

  • x

i a Optimum region Physical Exam Heart Rate Blood Pressure Shock Index Urine Output CVP/PCWP

O2 ATP Glucose

Substrates Goal Directed

Hemodynamic

  • Preload (CVP, PCWP)
  • Afterload (MAP, SVR)
  • Contractility (SV)
  • Heart Rate (BPM)
  • Shock Index (HR/SBP)
  • Coronary Perfusion Pressure
slide-5
SLIDE 5

5

Effects of perfusion pressure on tissue perfusion in septic shock

  • OBJECTIVE: To measure the effects of increasing MAP on

systemic O2 metabolism and regional tissue perfusion in septic shock.

  • DESIGN: Prospective study.
  • SETTING: MICU and SICU patients in a tertiary care teaching

hospital.

  • PATIENTS: 10 patients with septic shock requiring pressor

agents to maintain a MAP > 60 mm Hg after fluid resuscitation to a PAOP > 12 mm Hg.

LeDoux, Crit Care Med, 2000

Effects of perfusion pressure on tissue perfusion in septic shock

LeDoux, Crit Care Med, 2000 43+/-13 mL/h (NS) 49+/-18 mL/hr Urine Output 16+/-3 at 85 mm Hg (2.1+/-0.4 kPa) (NS) 13+/-3 mm Hg (1.7+/-0.4 kPa) A-Gastric pCO2 3.0+/- 0.9 mEq/L (NS) 3.1+/-0.9 mEq/L Lactate 5.5+/- 0.6 L/min/m2 (p < 0.03) 4.7+/- 0.5 L/min/m2 Cardiac Index 85 mmHg 65 mmHg

  • INTERVENTIONS: Norepinephrine was titrated to MAPs
  • f 65, 75, and 85 mm Hg in 10 patients with septic shock.
slide-6
SLIDE 6

6

Effects of perfusion pressure on tissue perfusion in septic shock

CONCLUSIONS:

– Increasing the MAP from 65 mm Hg to 85 mm Hg with norepinephrine does not significantly affect

  • systemic oxygen metabolism
  • skin microcirculatory blood flow
  • urine output
  • splanchnic perfusion.

LeDoux, Crit Care Med, 2000

Radial artery pressure monitoring underestimates central arterial pressure during vasopressor therapy in critically ill surgical patients

Critical Care Medicine 1998;26:1646-1649

Todd Dorman, MD, FCCM; Michael J. Breslow, MD, FCCM; Pamela A. Lipsett, MD; Jeffrey M. Rosenberg, MD, PhD; Jeffrey R. Balser, MD, PhD; Yaniv Almog, MD; Brian A. Rosenfeld, MD, FCCM

  • Radial artery pressure

underestimates central pressure in hypotensive septic patients receiving high-dose vasopressor therapy.

  • The higher mean femoral arterial

pressures:

– immediate reduction in norepinephrine infusions in 11 of the 14 patients.

  • Clinical management, based on

radial pressures, may lead to excessive vasopressor administration.

slide-7
SLIDE 7

7

slide-8
SLIDE 8

8

Low Dose to High Dose Vasopressor No Vasopressor to High Dose Vasopressor 20 40 60 No Vasopressor No Vasopressor to Low Dose Vasopressor

Mortality (%) 20% 37% 58% 54%

10 20 30 40 50 60 0-6 hours 6-72 hours 0-72 hours

% Receiving Vasopressors

15% No Corticosteroids

slide-9
SLIDE 9

9

O2 ATP Glucose

Substrates Goal Directed

DO2

  • PaO2
  • Hemoglobin
  • Cardiac Output

Hemodynamic

  • Preload (CVP, PCWP)
  • Afterload (MAP, SVR)
  • Contractility (SV)
  • Heart Rate (BPM)
  • Shock Index (HR/SBP)
  • Coronary Perfusion Pressure

An ICU Therapy Forever Changed

  • A restrictive strategy
  • f red-cell transfusion

is at least as effective as and possibly superior to a liberal transfusion strategy

slide-10
SLIDE 10

10

Stop An International Crisis

  • Transfusions do make

a difference in shock

  • r global tissue

hypoxia states.

  • Conservative

management during the convalescent phase. Abuse to the clinician after giving blood

Hemodilution After Volume

15 20 25 30 35 40 Baseline 3 hours 6 hours 7-72 hours Control Treatment

* * *

2 4 6 8 10 12 14 0-6 hours 6-72 hours 0-72 hours Control Treatment

339.49 447.13

50 100 150 200 250 300 350 400 450 500 0-72 hours

No difference in blood transfused over 72 hours between groups

3.6 Liters More Fluid 60 ml

108 ml

slide-11
SLIDE 11

11 Transfusion Decisions Depend on the Clinical Sate

DO 2crit VO2 Lactate Delivery Independent VO2 Delivery Dependent VO 2 SVO 2 OER DO 2 VO2 Lactate SVO2 OER

Hemodynamic Phases of Sepsis

SVO2 OER Lactate

  • Even SvO2 is a

combination of various tissue beds.

  • The coronary circulation is

at the highest risks.

slide-12
SLIDE 12

12 Transfusion Decisions Depend on the Clinical Sate

DO 2crit VO2 Lactate Delivery Independent VO2 Delivery Dependent VO 2 SVO 2 OER DO 2 VO2 Lactate SVO2 OER

Hemodynamic Phases of Sepsis

SVO2 OER Lactate

Transfusion Decisions Depend on the Clinical Sate

DO 2crit VO2 Lactate Delivery Independent VO2 Delivery Dependent VO2 SVO 2 OER DO 2 VO2 Lactate SVO 2 OER

Dietrich, Critical Care, Med, 2000 Marik, JAMA, 2000 Herbert, NEJM, 2001 Vincent, JAMA, 2002

slide-13
SLIDE 13

13

Transfusion Studies

3.4

  • 1.7 – 1.9

Cardiac Index Resuscitated

  • 5.3 - 6.1

CVP (mmHg) 69.5

  • 48.6 - 49.2

SvO 2 (%) 2.6

  • 1.8±1.8 -1.8±2.1

6.9 - 7.7 Lactate (mM/L) 9.9 10.1-12.2* 8.2-8.2 11.3 – 11.4 Hemoglobin 49.6 53-59 57-58 62-67 Age Up to 48 hours Over 2 weeks 24 hours <1 Time (hours) ICU ICU ICU ED Setting Marik, JAMA, 1993 Vincent, JAMA, 2002 Hebert, NEJM, 1999 EGDT, NEJM, 2002

Transfusion Studies

Excluding dialysis patients, patients likely to die in 24 hours and patients in established septic shock (systolic blood pressure <90 mmHg).

20-23%

16-13% 100%

In shock or global tissue hypoxia? Decreased pHi 18.5-10% ICU 22 -17% 28 day

22.2 vs. 28.1% (0.05) 56-30.5%

Mortality And Endpoints

  • 16.5-13.5

20.9±7.3- 21.3±8.1

20.4±7.4 - 21.4±6.9

APACHE

Marik, JAMA, 1993 Vincent, JAMA, 2002 Hebert, NEJM, 1999 EGDT, NEJM, 2002

slide-14
SLIDE 14

14

O2 ATP Glucose

Substrates Goal Directed

DO2

  • PaO2
  • Hemoglobin
  • Cardiac Output

Hemodynamic

  • Preload (CVP, PCWP)
  • Afterload (MAP, SVR)
  • Contractility (SV)
  • Heart Rate (BPM)
  • Shock Index (HR/SBP)
  • Coronary Perfusion Pressure

VO2

  • Stress
  • Pain
  • Hyperthermia
  • Shivering
  • Work of breathing

250 ml/min 25% 1000 ml/min SvO2 = 65

  • 75%

20 volume %

5 liters/min.

slide-15
SLIDE 15

15

70-75%

VO2

  • Stress
  • Pain
  • Hyperthermia
  • Shivering
  • Work of breathing

DO2

  • PaO2
  • Hgb
  • Cardiac Output
  • +

ScvO2 SvO2

Using Metabolic Endpoints

SvO2

slide-16
SLIDE 16

16

Lactate and Outcome

(Mizock, Dis Mon, 1989) (Weil, Circulation, 1970)

(Abramson and Scalea, J Trauma, 1993) 13.6 19 3 > 48 hrs 77.8 6 21 24-48 hrs 100 27 < 24 hrs % Survival Nonsurvivors Survivors Clearance 1 2 3 4 5 6 8 16 24 36 48 Time (hrs) Lactate (mM/L) Survivors Non-survivors

N = 76

slide-17
SLIDE 17

17

Crit Care Med 2004 Vol. 32, No. 8

  • No clearance
  • < 0 mM/L/hr
  • Intermediate clearance
  • 0-1 mM/L/hr
  • High clearance
  • > 1 mM/L/hr

∆ Lactate (ED Admission - ED Discharge) ED Length of Stay (hrs)

2 4 6 8 10 12 14 Lactate (mM/ L) No Clearance High Clearance ED Admission ED Discharge

14 16 84

N = 114

Crit Care Med 2004 Vol. 32, No. 8

∆ Lactate (ED Admission - ED Discharge) ED Length of Stay (hrs)

  • 30
  • 20
  • 10

10 20 30 40 50 60 70 80 Lactate Clearance % 1 2 3 4

N = 243

Quartiles of Lactate Clearance

slide-18
SLIDE 18

18

Early Lactate Clearance

12 24 36 48 60 72 6 3 4 5 6 7 8 9 10 11

No Clearance Intermediate Clearance High Clearance

Time (hr)

p<0.05

MODS

50 23 12 5 10 15 20 25 30 35 40 45 50 Mortality (%) No Clearance Intermediate Clearance High Clearance

1 2 3 4

1 2 3 4 5 6 7 8 9 10

Lactate Clearance Quartiles Caspase-3 (ng/mL)

% Lactate Clearance Quartiles and mean Biomarker Levels over 72 Hours

slide-19
SLIDE 19

19

1 2 3 4

1 2 3 4 5 6 7 8 9 10

Caspase-3 (ng/mL) 1 2 3 4

10 20 30 40 50 60 70 80 90 100 110 120

Tumor necrosis factor α (pg/mL)

% Lactate Clearance Quartiles and mean Biomarker Levels over 72 Hours

1 2 3 4

100 200 300 400 500 600 700 800 900 1000

Lactate Clearance Gropus IL-8 (pg/mL)

O2 ATP Glucose

Substrates Goal Directed

DO2

  • PaO2
  • Hemoglobin
  • Cardiac Output

Hemodynamic

  • Preload (CVP, PCWP)
  • Afterload (MAP, SVR)
  • Contractility (SV)
  • Heart Rate (BPM)
  • Shock Index (HR/SBP)
  • Coronary Perfusion Pressure

Microcirculation

VO2

  • Stress
  • Pain
  • Hyperthermia
  • Shivering
  • Work of breathing

Crit Care Med 2004 Vol. 32, No. 9

slide-20
SLIDE 20

20

The oxygen consumption-delivery relationship

G l

  • b

a l T i s s u e H y p

  • x

i a R e s u s c i t a t e d D e l i v e r y D e p e n d e n t

  • U

n d e r

  • R

e s u s c i t a t e d D e l i v e r y I n d e p e n d e n t ( c y t

  • p

a t h i c t i s s u e h y p

  • x

i a )

Microcirculatory Dysfunction

slide-21
SLIDE 21

21

  • Orthogonal polarization spectral (OPS) imaging

allows visualisationof the microcirculation.

  • Assessing microcirculatory flow in septic-shock

patients who had a MAP > 60 mm Hg and CVP > 12 mm Hg.

  • The infusion of 0.5 mg of nitroglycerin resulted

in a marked increase in microvascular flow on OPS imaging.

  • Improved recruitment of the microcirculation

could be a new resuscitation endpoint in septic shock.

Lancet 2002

Vascular occlusion and vasopressor use Ischemia and Cellular Hypoxia

Micro-Circulatory Defects

slide-22
SLIDE 22

22

Increasing O2 Consumption

Bihari, NEJM, 1987

30-minute infusion of a vasodilator, prostacyclin (5 ng/kg/min in 27 critically ill patients with acute respiratory failure and measured: O2 delivery and uptake to tissues Extraction ratio (uptake/delivery)

  • In the patients who died:

– O2 extraction ratio rose – VO2 did not change.

  • In the survivors:

– O2 extraction ratio fell – VO2 increased.

Increasing O2 Consumption

Bihari, NEJM, 1987

Conclusion: (an underappreciated endpoint)

– Substantial O2 debt or cryptic shock in patients who subsequently die. – Inadequate tissue oxygenation may be difficult to recognize – Important mechanism in the development of irreversible multiple organ failure.

slide-23
SLIDE 23

23

Oxygen Debt: To Pay or Not to Pay

Direct Association of Decreased VO2 Increased Mortality

  • Cardiac arrest (Rivers, Chest, 1994)
  • Trauma (Moore, J of Trauma, 1992)
  • Sepsis (Tuchschmidt, Chest, 1991)
  • Acute myocardial infarction (Rady, Chest, 1993)
  • Heart transplantation (Mancini, J Clin Monit, 1991)
  • Liver transplantation (Chest, 1992)
  • ARDS (Appel, Chest, 1992)
slide-24
SLIDE 24

24

O2 ATP Glucose

Substrates Endpoints of Resuscitation

Lactate

Happy Cell

Base Deficit (a-v)CO2 SvO

2

pHi DO2 Mediators

Goal Directed

DO2

  • PaO2
  • Hemoglobin
  • Cardiac Output

Hemodynamic

  • Preload (CVP, PCWP)
  • Afterload (MAP, SVR)
  • Contractility (SV)
  • Heart Rate (BPM)
  • Shock Index (HR/SBP)
  • Coronary Perfusion Pressure

Microcirculation

VO2

  • Stress
  • Pain
  • Hyperthermia
  • Shivering
  • Work of breathing

Metabolic Endpoints of Resuscitation

VO2

VO2 DO2 Critical DO2

Delivery Dependent Delivery Independent

G l

  • b

a l t i s s u e h y p

  • x

i a

ScvO2 (a-v)pCO2 Gastric Tonometry Sublingual Cap. Base Deficit Lactate

Pulmonary Artery Catheter in the ICU

O2 extraction Optimum region

slide-25
SLIDE 25

25

(a-v) pCO2 Gradient < 5 mmHg

  • PaCO2↓ but PvCO2↑ in circulatory

failure and low flow states

(Mecher, Crit Care Med, 1990)

  • Inverse relationship between CI and

(a-v) pCO2

(Ducey, Crit Care Med, 1992), (Durkin, J Crit Care, 1993) (Rackow, Crit Care Med, 1994), (Teboul, Crit Care Med, 1998)

  • ↑(a-v) pCO2 increases mortality

(Bakker, Chest, 1992)

PcvCO2 PmvCO2 PaCO2

(a-v) pCO2 and Cardiac Index

(Cuschieri, Rivers and Donnino, I nt Care Med, 2005)

2 4 6 8 10 2 4 6 8 10

(a-mv)pCO2 (mmHg) CIpac(L/min/m 2)

2 4 6 8 10 2 4 6 8 10

(a-cv)pCO2 (mmHg) CIpac(L/min/m 2 )

ln(CI) = 1.942 - 0.18(a-mv)pCO2 r2 = 0.87 ln(CI) = 1.884 - 0.173(a-cv)pCO2 r2 = 0.90

Mixed venous Central venous

N = 83

slide-26
SLIDE 26

26

Sublingual Capnometry

Weil, Crit Care Med 1999; 27:1225-1229.

26 20 5 N >2.5 < 2.5 Lactate (mM/L) 81 +/- 24 53 +/- 8 45.2 +/- 0.7 PSL CO2 mm Hg physical signs of circulatory shock without clinical signs of shock healthy volunteers When PSL CO (2) > 70 mm Hg, its positive predictive value for the presence of physical signs of circulatory shock was 1.00. When it was <70 mm Hg, it predicted survival with a predictive value of 0.93. 34 12 N (r2 = .84; p < .001) Correlation with lactate 58 + 11 93 + 27 Initial PSL CO2 mm Hg Survivors Died from shock

slide-27
SLIDE 27

27

Base Deficit

  • Amount of base required to

titrate 1L blood to normal pH.

  • Indicator of volume deficit.
  • Guide to resuscitation in

trauma patient.(Davis, J Trauma, 1988)

  • Affected by administration
  • f bicarbonate, temp,

ETOH, heparin.

Can I use Base Deficit or Anion Gap?

>10 7.0 to 9.9 4.0 to 6.9 Lactate Range mmol/L 0% 8.3% 11.1% Serum HCO3>22 and A.G. <15

Wira and Rivers, Crit Care Med, 2005

slide-28
SLIDE 28

28

Crit Care Med, 2007 Severe Global Tissue Hypoxia:

Lactate > 4 mmole/liter

and ScvO2 < 70%)

Moderate Global Tissue Hypoxia:

Lactate < 4 and >2 mmole/liter

and ScvO2 < 70%

Resuscitated:

Lactate < 2 mmole /liter and ScvO2 > 70%

slide-29
SLIDE 29

29

12 24 36 48 60 72 3 6 200 400 600 800 1000 1200 1400 Hours after the start of treatment Il-8 (pg/dL) 12 24 36 48 60 72 3 6 100 200 300 400 500 Hours after the start of treatment IL-8 murine (pg/mL)

EGDT Standard Therapy Lactate > 4 mM/L and ScvO2 <70% Lactate > 2 and < 4 mM/L and ScvO2 <70% Lactate < 2 mM/L and ScvO2 > 70%

Chest, 2005

12 24 36 48 60 72 3 6 25 50 75 100

Hours after the start of treatment TNF-α (pg/mL) 12 24 36 48 60 72 3 6 25 50 75 100 125 150 175 200 Hours after the start of treatment TNF-α (pg/mL) 12 24 36 48 60 72 3 6 1 2 3 4 5 Hours after the start of treatment Caspase-3 (ng/mL) 12 24 36 48 60 72 3 6 1 2 3 4 5 6 7 8 9 10 Hours after the start of treatment Caspase-3 (ng/mL)

Tumor Necrosis Factor Caspase-3

slide-30
SLIDE 30

30

12 24 36 48 60 72 3 6 2500 5000 7500 10000 12500 15000 EGDT Control Hours after the start of treatment IL-1ra (pg/mL) 12 24 36 48 60 72 3 6 2500 5000 7500 10000 12500 15000 17500 20000 Lactate>4 and ScvO2<70% Lactate>2 and ScvO 2<70% Lactate<2 and ScvO2>70% Hours after the start of treatment IL-1ra (ng/mL) 12 24 36 48 60 72 3 6 100 200 300 400 500 Hours after the start of treatment ICAM-1 (ng/mL) 12 24 36 48 60 72 3 6 100 200 300 400 500 600 Hours after the start of treatment ICAM-1 (ng/mL)

Intracellular Adhesion Molecule IL-1 receptor Antagonist

slide-31
SLIDE 31

31

slide-32
SLIDE 32

32

Optimization Trials

“A Closer Look”

Mortality

(Boyd, New Horiz, 1996)

Early Late

(Kern, Crit Care Med, 2002)

slide-33
SLIDE 33

33

O2 ATP Glucose

Substrates Endpoints of Resuscitation

Lactate

Happy Cell

Base Deficit (a-v)CO2 SvO

2

pHi DO2 Mediators

Goal Directed

DO2

  • PaO2
  • Hemoglobin
  • Cardiac Output

Hemodynamic

  • Preload (CVP, PCWP)
  • Afterload (MAP, SVR)
  • Contractility (SV)
  • Heart Rate (BPM)
  • Shock Index (HR/SBP)
  • Coronary Perfusion Pressure

Microcirculation

VO2

  • Stress
  • Pain
  • Hyperthermia
  • Shivering
  • Work of breathing