End result Implementation Resources used Google maps Formsbased - - PowerPoint PPT Presentation

end result
SMART_READER_LITE
LIVE PREVIEW

End result Implementation Resources used Google maps Formsbased - - PowerPoint PPT Presentation

4/16/2019 The teaching goal: Dept Earth, Ocean & Atmospheric Sciences Enhance student motivation Automating Creative, Peerreviewed Projects to Enhance Tactics known to enhance motivation: Motivation in a large 1 st yr course


slide-1
SLIDE 1

4/16/2019

Automating Creative, Peer‐reviewed Projects to Enhance Motivation in a large 1st yr course (EOSC114, Natural Hazards)

Francis Jones and Lucy Porritt

First Year Educators’ Symposium, UBC, January 2019

With thanks to: TLEF funding ~ S. Harris ~ instructors ~ many teaching assistants ~ students during “trial & error” Dep’t Earth, Ocean & Atmospheric Sciences Faculty of Science

*This slide‐set licensed under Creative Commons, attribution non‐commercial share‐alike. * Contact: Francis Jones, Science Education Specialist, EOAS, UBC, fjones@eoas.ubc.ca

The teaching goal:

Enhance student motivation

  • Tactics known to enhance motivation:

… empower: students choose a topic and context; … vested interest: incorporate a personal perspective; … individually create an information package; … Peer review and provide feedback (not grading); … Gather collected work as a custom learning resource.

  • Also ‐ minimize costs to the EOSC114 instructing team:

… ~1750 students / year … 5 f2f and 3 DE sections / year … 6 instructors / term

Many references on how motivation factors into learning, and what strategies support or foster it.
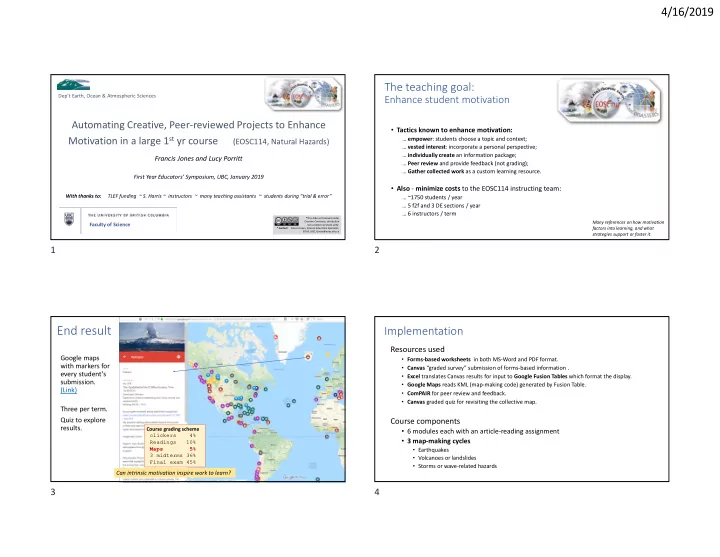
End result

Google maps with markers for every student’s submission. (Link) Three per term. Quiz to explore results.

Course grading scheme clickers 4% Readings 10% Maps 5% 3 midterms 36% Final exam 45%

Can intrinsic motivation inspire work to learn?

Implementation

Resources used

  • Forms‐based worksheets in both MS‐Word and PDF format.
  • Canvas “graded survey” submission of forms‐based information .
  • Excel translates Canvas results for input to Google Fusion Tables which format the display.
  • Google Maps reads KML (map‐making code) generated by Fusion Table.
  • ComPAIR for peer review and feedback.
  • Canvas graded quiz for revisiting the collective map.

Course components

  • 6 modules each with an article‐reading assignment
  • 3 map‐making cycles
  • Earthquakes
  • Volcanoes or landslides
  • Storms or wave‐related hazards

1 2 3 4

slide-2
SLIDE 2

4/16/2019

  • Choose & Research a
  • hazard. Personal or family

experience, or interesting to you.

  • complete the MS‐Word or

PDF form provided.

  • B. Submit data 

and PDF 

Weeks 1‐2:

Complete & submit worksheets

ANSWER

  • A. Short quiz related

to a previous map with every‐

  • ne’s data.

Map project students’ task flow

Typical time on task: ‐ Gather & deliver info. 40 ± 18 mins.

Weeks 3‐4: Peer review in ComPAIR

  • B. Give constructive feedback to BOTH

Repeat, 3 times + self‐review

  • A. Compare pairs of submissions.

using 5 criteria provided.

5 criteria

… … Typical time on task: ‐ Peer review: 55 ± 30 mins. Short quiz ~ 15 questions ‐ Causes everyone to visit the collective map.

Instructor’s and TAs’ roles

  • Instructor: mainly managing logistics
  • Review and approve or adjust mapping information forms.
  • Deploy tasks in Canvas and ComPAIR (check links work properly)
  • Manage students’ technical “exceptions” (similar to online learning)
  • Check map & associated quiz questions (based on Canvas question banks)
  • Establish and manage grading.
  • TAs: Build the Google map ( < 1hr after training)
  • Download from Canvas – quality check (duplicates, etc.).
  • Use templates to translate for import to Google Maps.
  • Fine tune Google map for clarity and ease of viewing.
  • Adapt 15 map‐specific questions using existing question templates.
  • Respond to students in office hours and discussion boards.

Testing and deployment

  • 1. First pilot term:
  • Using Connect
  • 7 maps
  • Test / develop map‐making procedure
  • 2. Second pilot term:
  • 6 maps
  • Add 2 quizzes
  • Trial peer‐review using quiz‐based

procedure (awkward)

  • 3. Third pilot term:
  • Switch to Canvas
  • 4 maps + one made from “favorites”
  • Quiz on each
  • ComPAIR pilot – review 2 plus self‐eval
  • 4. Fourth pilot term (current):
  • 3 maps + 4 longer quizzes
  • Refined ComPAIR; review 3 pairs + self‐eval.
  • Try checking compliance using ComPAIR

analytics and “sampling” by TAs.

  • 5. Final implementation (Sept 2019):
  • 3 maps + 4 quizzes
  • New map‐making strategy
  • Fusion Tables are being phased out.
  • ComPAIR: review 3 pairs plus self‐eval.
  • Compliance via ComPAIR analytics
  • ComPAIR “ranking”? To select submissions for

public display (with permission).

Data collection throughout – done “non‐invasively” as part of assignment deliverables.

Map‐making: personal connection, compliance & perceptions

40 50 60 70 80

any eq vo/ls st st‐de

Descrip'n word counts

avg med

Word counts for submitted “description” “What workload & grading scheme would you prefer?”

  • 62% of respondents want same or more tasks.
  • 81% want same or more weight for grading.

"What did you like, or do you think worked well?" Feedback comment codes % of 100 samples Supports self‐interest and choice 30% expand beyond assigned learning 25% maps; seeing my & others' entries 16% helped with learning 13% real life connection 11% Helped see the big picture 10%

  • ther

9% reuse of prior work 8% quick ‐ easy 7% negative 4%

5 6 7 8

slide-3
SLIDE 3

4/16/2019

Peer review compliance and perceptions:

Compliance with peer reviewing: Maps 1,2,3 Map 4

Did full requirement: 88% 86%. Did self‐evaluations: 82% 73%.

Word counts for ComPAIR feedback.

0% 10% 20% 30% 40% 50% ... was very easy and not at all… ... was fairly easy and not very… ... was a little difficult or confusing ... was very difficult or confusing

Was doing comparisons hard? Confusing? First Last

Comparisons: challenging for ~10% after practicing.

I asked … Can intrinsic motivation inspire work to learn? Results are suggestive that ‐ yes, intrinsic motivation can inspire such work.

Lessons learned; implications for improvement

Teaching skills required to administer this automated project:

  • Logistics: aligning worksheets & Canvas quizzes; question banks; analysis of results
  • ComPAIR: setting up, designing comparison criteria
  • Google map‐making – but still a work in progress.
  • Managing the 10% of students who encounter problems.
  • Training and coordinating TAs.
  • Targeting motivation is possible in large classes using elements of …

> choice > vested interest > peer‐review > creating a “collective” learning resource.

Challenges

  • Sustainability / transfer: challenging, especially with multiple instructors.
  • Map‐making environment is a moving target (Google …)
  • Several ideas; project proposals are awaiting funding.
  • Forms: success with MS‐Word forms …or… PDFs varies (required for delivery to ComPAIR).
  • Peer‐review needs refining to promote improvement of skills.

Th Thank yo you!

Abstract

Promoting student motivation is challenging in very large classes because it is difficult to interact with, or assess, students individually. We are exploring one approach to promoting students’ sense of personal relevance, interest and motivation in EOSC114 “The Catastrophic Earth; Natural Disasters”, which has annual enrollments of

  • ver 2000 in both face‐to‐face and distance education sections.

Students choose any personally meaningful hazardous event and create their own information package that is submitted using an online form. Results are converted into a Google Map with markers and corresponding personally unique information created by every student. Peer‐reviews are then carried out using structured‐comparison in ComPAIR, and the assignment concludes with a short quiz about the collectively created map. Automating these steps (completed three times each term) enables hundreds of students to choose, research, create and peer‐review individual contributions to a global map that students then explore. We will summarize objectives, students’ tasks and logistics for delivering this automated learning sequence. Preliminary results will be presented demonstrating student outcomes, success at meeting our teaching goals, and lessons we are learning about this approach to delivering personally meaningful learning experiences in very large classes.

9 10 11 12

slide-4
SLIDE 4

4/16/2019

Students' map‐making task

Weeks 1 & 2 1. Choose any (volcano or landslide) event 2. Gather information for recording using forms. (Demo the form). 3. Submit to a Canvas “Graded Survey” with identical questions. 4. Deliver completed form to ComPAIR. Weeks 3 & 4 1. View two randomly chosen submission PDFs in ComPAIR. 2. Make five guided decisions about “which of the two is better at … ” 3. Write succinct feedback to BOTH. 4. Repeat 3 times. 5. Revisit your own submission and offer feedback to yourself. 6. Complete a 15‐qn quiz based on the current collective global hazard map.

Some descriptive data

Students’ chosen events include:

  • Favorite hazard types
  • Written descriptions: 60‐100 words
  • Nature of personal experiences …
  • Aspect of hazards that is of most interest …
  • Type of question posed to author …

Examples of student perceptions & feedback data

“What workload and grading scheme change would you prefer?”

  • 62% of respondents want same or more tasks
  • 81% want same or more grade‐weight for that work.

Proportion of respondants (N=387) | Strong a Agree Neutral Disagree Strong d Understand the course concepts better than if there had been no project. 7% 41% 33% 12% 6% Increase your own interest in at least some of these natural hazards topics. 14% 50% 23% 8% 5% Appreciate choice, & exploring aspects that you are most interested in. 0% 62% 25% 9% 4% Appreciate opportunity to see and compare the work of other students. 12% 41% 30% 14% 4%

Generally: agreed that map project was interesting and beneficial. Especially: “Choice” & “Exploring an aspect you are most interested in”.

Implementation

Resources used

  • Forms‐based worksheets in both MS‐Word and PDF format.
  • Canvas “graded survey” submission of forms‐based information .
  • Excel translates Canvas results for input to Google Fusion Tables which format the display.
  • Google Maps reads KML (map‐making code) generated by Fusion Table.
  • ComPAIR for peer review and feedback.
  • Canvas graded quiz for revisiting the collective map.

Course components

  • 6 modules, 6 reading assignments, 3 map‐making cycles.

Key events 1st day classes midterm1 midterm2 midterm3 Last class

Modules v ex

earthquakes assignment volcanoes assignment landslides assignment Waves assignment Storms assignment

  • Stu. map work

extinctions/impacts assig. review map2 + quiz map2

reading wk

Students Assignments

bckgnd check 1 bckgnd check 2 review map1

waves storms

Add drop

Fragile sys I earthquakes volcanoes landslides wave

April January February March

quiz, prior‐yr map + map1 (eq) quiz map1 + map 2 (vo/ls) map 3 (wa/st) review map 3 + quiz on maps 3,2,1 extinct/impact Fragile sys. II

13 14 15 16