
SLIDE 1
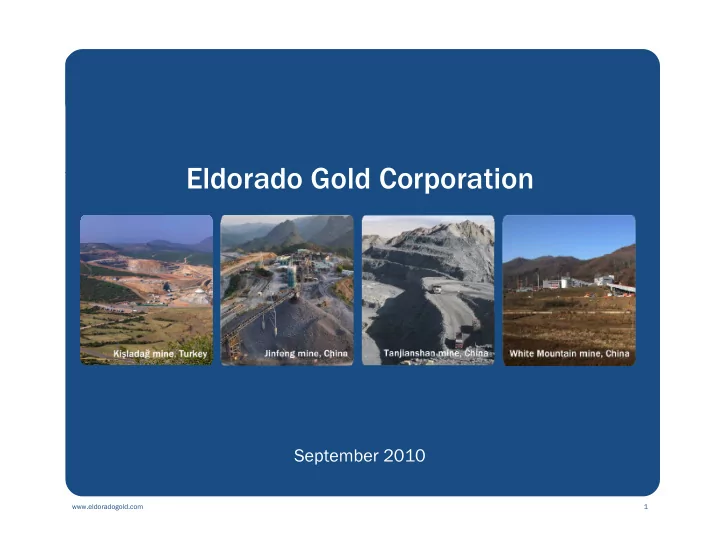
Eld r d G ld C r r ti Eldorado Gold Corporation
September 2010
www.eldoradogold.com
September 2010
1
Eld r d G ld C r Eldorado Gold Corporation r ti September 2010 - - PowerPoint PPT Presentation
Eld r d G ld C r Eldorado Gold Corporation r ti September 2010 September 2010 www.eldoradogold.com 1 Forward-Looking Statements Certain of the statements made in this Presentation may contain forward-looking statements within the meaning of
www.eldoradogold.com
1
Certain of the statements made in this Presentation may contain forward-looking statements within the meaning of the United States Private Securities Litigation Reform Act of 1995 and forward-looking information within the meaning of applicable Canadian securities law. These forward-looking statements or information include, but are not limited to statements or information with respect to financial disclosure, estimates of future production, the future price of gold, estimations of mineral reserves and resources, estimates of anticipated costs and expenditures, development and production timelines and goals and strategies. We have made numerous assumptions about the forward-looking statements and information contained herein, including among other things, assumptions about the price of gold, anticipated costs and We have made numerous assumptions about the forward looking statements and information contained herein, including among other things, assumptions about the price of gold, anticipated costs and expenditures and our ability to achieve our goals. Even though our management believes that the assumptions made and the expectations represented by such statements or information are reasonable, there can be no assurance that the forward-looking statement or information will prove to be accurate. Forward-looking statements and forward-looking information by their nature are based on assumptions and involve known and unknown risks, uncertainties and other factors which may cause the actual results, performance or achievements of the Company to be materially different from any future results, performance or achievements expressed or implied by such forward-looking statements or
statements or information. Such risks, uncertainties and other factors include, among others, the following: gold price volatility; discrepancies between actual and estimated production, mineral reserves and resources and metallurgical recoveries; mining operational and development risk; regulatory restrictions, including environmental regulatory restrictions and liability; risks of sovereign investment; currency fluctuations; speculative nature of gold exploration; global economic climate; dilution; share price volatility; competition; loss of key employees; additional funding requirements; and defective title to mineral claims or property, as well as those factors discussed in the section entitled "Risk Factors" in the Company's Annual Information Form & Form 40-F dated March 31, 2010. Should one or more of these risks uncertainties or other factors materialize or should underlying assumptions prove incorrect actual results may vary materially from those described in forward-looking statements and these risks, uncertainties or other factors materialize, or should underlying assumptions prove incorrect, actual results may vary materially from those described in forward looking statements and information. Although we have attempted to identify factors that would cause actual actions, events or results to differ materially from those described in forward-looking statements and information, there may be other factors that cause actual results, performances, achievements or events to not be as anticipated, estimated or intended. Also many of the factors are beyond our control. There can be no assurance that forward-looking statements or information will prove to be accurate, as actual results and future events could differ materially from those anticipate in such statements. Accordingly you should not place undue reliance on forward-looking statements or information. Except as required by law, we do not expect to update forward-looking statements and information continually as conditions change and you are referred to the full discussion of the Company's business contained in the Company's reports filed with the securities regulatory authorities in Canada and the U.S. All forward-looking statements and information contained in this presentation are qualified by this cautionary statement. y Cautionary Note to U.S. Investors: Mineral Reserves and Mineral Resources - The terms "mineral reserve", "proven mineral reserve" and "probable mineral reserve" referred to in the Company's disclosure are Canadian mining terms as defined in accordance with National Instrument 43-101 - Standards of Disclosure for Mineral Projects under the guidelines set out in the Canadian Institute of Mining, Metallurgy and Petroleum (the "CIM") Standards on Mineral Resources and Mineral Reserves, adopted by the CIM Council on August 20, 2000 as may be amended from time to time by the CIM. These definitions differ from the definitions in the United States Securities & Exchange Commission ("SEC") Guide 7. Under SEC Guide 7 standards, a “final” or “bankable” feasibility study is required to report reserves, the three- year historic average price is used in any reserve or cash flow analysis to designate reserves and the primary environmental analysis or report must be filed with the appropriate governmental authority. The terms "mineral resource", "measured mineral resource", "indicated mineral resource", "inferred mineral resource" used in the Company's disclosure are Canadian mining terms as defined in accordance with National Instrument 43-101 - Standards of Disclosure for Mineral Projects under the guidelines set out in the CIM Standards. Mineral resources which are not mineral reserves do not have demonstrated economic viability. While the terms "mineral resource", "measured mineral resource," "indicated mineral resource", and "inferred mineral resource" are recognized and required by Canadian regulations, they are not defined terms under standards in the United States and normally are not permitted to be used in reports and registration statements filed with the SEC. As such, information contained in the Company's disclosure concerning descriptions of mineralization and resources under Canadian standards may not be comparable to similar information made public by U.S companies in SEC filings. With respect to "indicated mineral resource" and "inferred mineral resource" there is a great amount of uncertainty as to their existence and a great uncertainty as to their economic and legal feasibility. It can not be assumed that all
categories will ever be converted into reserves.
www.eldoradogold.com 2
Eldorado Gold is a Canadian gold producer with 4 operating mines, 2 mines under construction, development projects and an extensive 2010 exploration program. We
p , y, , g g
www.eldoradogold.com 3
($0.07 per share Q2 2009);
$200,000
Increasing Net Cash (in thousands US$)
cash operating cost of $357/oz (total cash cost of $410/oz); S ld 172 826 f g ld t li d
$100,000 $150,000 Net Cash
average price of $1,195/oz;
per share from operating activities before
$0 $50,000 2006 2007 2008 2009 Q1 2010 Q2 2010
p p g changes in non-cash working capital;
(C$0.05/share);
150 200 z x1,000)
Increasing Quarterly Production (x1,000 oz)
approximately C$122.4 million.
50 100
www.eldoradogold.com
Q1 2009 Q2 2009 Q3 2009 Q4 2009 Q1 2010 Q2 2010 G
4
1,200 ) $500 ) Perama Hill E t D g
$1,110$1,195 $1,400
Forecast Annual Gold Production (in ounces) Expanding Margins (in $/oz)
400 600 800 1,000 duction (x1,000 oz $200 $300 $400 perating Cost ($/oz) Eastern Dragon Efemçukuru White Mountain Jinfeng
279 411 587 658 713 785
$609 $674 $876 $995 $ , $400 $600 $800 $1,000 $1,200
Margins Total Cash Cost 200 400 2009 2010 2011 2012 2013 Gold Prod $0 $100 Cash Op Tanjianshan Kişladağ Cash Operating Cost ($/oz)
330 263 289 337 397 410
$0 $200 $400 2006 2007 2008 2009 Q1 2010 Q2 2010
Realized Gold Price
30,000 0 oz)
I f d
2009 Gold Resources and Reserves (in x1000 oz) Lowest Quartile of Production Cost (in $/oz)
AEM GFI ANG ABX $600 $/oz) 10,000 20,000 ld In-Situ (x1,000
Inferred M+I P+P Column 4 Column 3 ELD (2011)
POG ELD (2010)
RBI AUY LGL CG GOLD GG KGC NCM IAG AEM NEM $450 Total Cash Cost ($
www.eldoradogold.com
2006 2007 2008 2009 Go
ELD (2011)
$300 4,000 8,000 2010E Gold Equivalent Production (x1,000 oz)
Data source: BMO Capital Markets, Bloomberg and Eldorado
5
Return on Shareholders Equity Share Price Performance
$9,000
Return on Share Capital:
470% 500%
TSX: ELD
C$19.08
$3,000 $6,000 C$ millions Market Capitalization Share Capital
Issued C$2.3 billion in shares Increased market capitalization to C$8.1 billion p 328% (38% annualized)
185% 200% 300% 400%
S&P/TSX Global Gold (^SPTTGD) S&P/TSX
A i d R d R Pl tf O i R d R G th
$0 2000 2003 2006 2009 Share Capital Additions 85% 22% 0% 100%
2005 2006 2007 2008 2009 30-Jun- 10 Composite (^GSPTSE) SPDR Gold Shares (GLD)
C$3.35
30/06/2010
Acquired Resource and Reserve Platform Since December 1998 Organic Resource and Reserve Growth Since December 1998
20,000 0 oz) $ $100 Organic Resource (excluding
Average cost
16,000 0 oz)
Average cost of acquired
5,000 10,000 15,000 tained Gold (x1,000 $25 $50 $75 in $ million (excluding Reserve) Organic Reserve
g
$6.5/oz
4,000 8,000 12,000 tained Gold (x1,000 Acquired Resource (excluding Reserve) Acquired Sino Gold Frontier Pacific Afcan
resource
1997: $148/oz www.eldoradogold.com
1998 2003 2008 Cont $0 Cumulative Exploration Spending 1998 2000 2002 2004 2006 2008 Cont Reserve Afcan Gencor
6
28% 30% 16% 14% 13% 11% 9% 9% 4% 10% 20%
10%
0% ELD YRI AEM K IMG CG G GSS NGX ABX
www.eldoradogold.com
Source: Globe and Mail (August 17, 2010)
7
an open pit heap leach gold mine that began commercial production in July 2006
10Mt/year at 1.03 g/t Au with a strip ratio of 1.21:1 (265,000 oz Au)
Type Open pit, heap leach gold mine P+P reserves* 7,794,000 oz of gold @ 0.92 g/t M+I resources * 11,118,000 oz of gold @ 0.72 g/t
g y 7.79 M oz and M+I gold resources increased by 0.85 M to 11.12 M oz since Dec 2009
result in increase production to 12 Mt/year in 2011
Inferred resources* 3,771,000 oz of gold @ 0.44 g/t Q2 2010 production 70,451 oz of gold Q2 2010 cash operating cost $304/oz
2011
months of 2010 at a cash operating cost of $304/oz
20,000 meters of drilling has defined new high grade zones and upgraded areas within the known deposit.
100 000 200,000 300,000 400,000 Gold Production (oz) $100 $200 $300 $400 perating Cost ($/oz) www.eldoradogold.com 100,000 2008 2009 2010 2011 2012 2013 Annual $0 $100 Cash O
* As of June 30, 2010
8
an open pit and underground gold mine that began commercial production in September g p p 2007
venture partner Guizhou Lannigou Gold Mine Limited holding the remaining 18%
Type Open pit and underground mine P+P reserves* 3,232,000 oz of gold @ 5.20 g/t M+I resources* 4,330,000 oz of gold @ 4.65 g/t
Mt (1.1 Mt from the open pit and 0.4 Mt from the underground mine) at 4.96 g/t Au (~ 190,000 oz Au)
Inferred resources* 674,000 oz of gold @ 3.91 g/t Q2 2010 production 52,659 oz of gold Q2 2010 cash operating cost $381/oz
2010, dropping to 5.8:1 in 2011
determine the optimum pit depth and p p p underground mining methods
includes ~13,600 m of diamond drilling, with new drill targets defined by revised Jinfeng
100 000 200,000 300,000
$200 $300 $400 $500 erating Cost ($/oz) www.eldoradogold.com
deposit structural model.
100,000 2009 2010 2011 2012 2013 Annual Go $0 $100 Cash Ope
* Ore resources and reserves are calculated as at 31 December 2008 and presented in accordance with the JORC Code, which is equivalent under the corresponding categories of mineral reserves under NI 43-101 to CIM Standards.
9
China, is an open pit, float-roast-CIL operation that began commercial production in February g p y 2007
Geological Brigade (5%) and the Dachaidan Gold Mine (5%)
Type Open pit, float-roast-CIL P+P reserves 710,000 oz of gold @ 3.59 g/t M+I resources 916,000 oz of gold @ 3.07 g/t
in Q2 2009
average grade of 3.85 g/t Au. Mining will
Inferred resources 349,000 oz of gold @ 3.54 g/t Q2 2010 production 28,884 oz of gold Q2 2010 cash operating cost $387/oz
average grade of 3.85 g/t Au. Mining will continue from the JLG pit at a strip ratio of 2.5:1 (~ 105,000 oz Au)
diamond drilling on the 323 zone, QLT deeps g , Q p and other anomalies. Initial 323 zone resource estimate to be released in Q3 2010
2010, including installation of a flash flotation
100,000 200,000
$200 $300 $400 $500 erating Cost ($/oz) www.eldoradogold.com
cell designed to improve flotation recoveries. Both the mine and plant are operating according to plan.
2009 2010 2011 2012 2013 Annual Go $0 $100 Cash Ope 10
China, is an underground mine using a sub- level and cut-and-fill stoping mining method p g g
January 2009
venture partner Jilin Tonghua Institute of
Type Underground mine, CIL plant P+P reserves* 790,000 oz of gold @ 3.70 g/t M+I resources* 1 079 000 oz of gold @ 3 10 g/t
venture partner Jilin Tonghua Institute of Geology and Minerals Exploration and Development owning the remaining 5%
600,000 t of ore at a grade of 4.0 g/t Au
M+I resources 1,079,000 oz of gold @ 3.10 g/t Inferred resources* 109,000 oz of gold @ 2.10 g/t Q2 2010 production 15,946 oz of gold Q2 2010 cash operating cost $442/oz
600,000 t of ore at a grade of 4.0 g/t Au
production to utilize excess capacity in the mill
10 500 m of diamond drilling ~10,500 m of diamond drilling.
50,000 100,000
$400 $500 erating Cost ($/oz) www.eldoradogold.com 2009 2010 2011 2012 2013 Annual Go $300 Cash Ope
* Ore resources and reserves are calculated as at 31 December 2008 and presented in accordance with the JORC Code, which is equivalent under the corresponding categories of mineral reserves under NI 43-101 to CIM Standards.
11
a high grade epithermal gold deposit, suited for underground mechanized mining underground mechanized mining
October 2009
Type Underground mine under construction P+P reserves 1 506 000 oz of gold @ 9 10 g/t
production planned for 2011. Underground development began in Q3 2010
112 400 t h ti g t f
P+P reserves 1,506,000 oz of gold @ 9.10 g/t M+I resources 1,700,000 oz of gold @ 9.55 g/t Inferred resources 352,000 oz of gold @ 6.43 g/t Capex $152 million
112,400 oz at a cash operating cost of ~ $280/oz
includes ~5,000 meters of diamond drilling, on both the parallel Kokarpinar vein system, and on the northwest extension of the main ore zone.
50 000 100,000 150,000
$100 $200 $300 erating Cost ($/oz) www.eldoradogold.com 50,000 2011 2012 2013 Annual Go $0 $100 Cash Ope 12
Province, China, is a high-grade, low- sulphidation epithermal gold silver vein sulphidation, epithermal, gold-silver vein deposit
private joint venture partner holding 5%
Type Open pit and underground, CIL plant under construction Gold Silver P P 747,000 oz @ 6,552,000 oz @
report was approved in August 2009
March 2010. P+P increased 42% to 747,000
P+P reserves 747,000 oz @ 8.42 g/t 6,552,000 oz @ 74 g/t M+I resources 852,000 oz @ 7.50 g/t 8,300,000 oz @ 73 g/t Inferred resources 190,000 oz @ 2 67 g/t 1,500,000 oz @ 20 g/t
c eased to 85 ,000 o Au
2010, along with regional exploration
2.67 g/t 20 g/t
2011
50,000 100,000 d Production (oz) $100 $200 ating Cost ($/oz) www.eldoradogold.com 2011 2012 2013 Annual Gold $0 Cash Opera 13
non-refractory oxide gold deposit with a low strip ratio p
has been submitted in October 2009
filed during Q1 2010
Type Open pit P+P reserves 966,000 oz of gold @ 3.20 g/t M+I resources 1 363 000 oz of gold @ 3 62 g/t
filed during Q1 2010
submitted in the second half of 2010
i i d i 2011
M+I resources 1,363,000 oz of gold @ 3.62 g/t Inferred resources 552,000 oz of gold @ 1.96 g/t Pr Project operatin
parameters rs Strip ratio 0.35:1
anticipated in 2011
activities prior to planned construction
Estimated metallurgical recovery 90% Construction anticipated to commence 2011 Construction Capital $159 M Average cash operating cost $278/oz
g economic developments in Greece as positive for the permitting and timely development of the project
www.eldoradogold.com
g p g / Average annual production 110,000 oz of gold
14
stage, and generative programs for sustainable organic growth
www.eldoradogold.com 15
China
exploration Nevada
exploration Turkey p
program Brazil
exploration projects Turkey
Kişladağ minesite
porphyry projects apajós ge e at e
advanced stage
www.eldoradogold.com
p p y y p j
exploration projects
16
www.eldoradogold.com 17
www.eldoradogold.com
18
Eastern Dragon project
Heilongjiang Province
White Mountain mine
Jilin Province
Tanjianshan mine
Qinghai Province
www.eldoradogold.com
Jinfeng mine
Guizhou Province
19
Fallacy Fact
The refining and selling of gold is tightly There is a choice of refineries (including Metalor) and the producer The refining and selling of gold is tightly controlled and the producer receives a discount to the spot price. There is a choice of refineries (including Metalor) and the producer is free to negotiate with the preferred refinery. Terms and conditions are similar to those outside China. Refined gold is sold
If a dispute arises with your Chinese partner there is no recourse or legal security. There is a legal framework in China under which disputes can be
the joint venture contract. This arbitration is commonly conducted
specifies that arbitration would take place in Singapore. The percentage of foreign ownership is restricted to less than 50%. The only restriction is the requirement to set up a joint venture with a Chinese partner. The foreign partner has the ability to control +95% of the joint venture.
www.eldoradogold.com 20
Fallacy Fact
Gold mining is in the “prohibited” category and The Foreign Investment Catalogue places investment in the gold Gold mining is in the prohibited category, and the size of deposit available to foreign companies is limited. The Foreign Investment Catalogue places investment in the gold sector in the “restricted” category. The restricted category simply means that there are no tax incentives and the government is more cautious about the company investing. There is no official limitation on the size of the deposit available to foreign companies – for example Jinfeng has a 4.3 million oz resource. p g China can’t be a good place to work – there aren’t any majors there. The perceived lack of mega-sized deposits is due more to the historical system of Chinese exploration (low tech) than to actual geologic constraints. In addition, for companies that simply want to “buy assets” they will be at a disadvantage due to the f C competition from Chinese companies. Foreign companies are only able to develop low grade, refractory deposits. At Tanjianshan the QLT open pit graded over 6 g/t of non- refractory ore. The Eastern Dragon deposit has an M+I resource grade of 8.3 g/t. The low grade and refractory criteria for foreign investment no longer applies investment no longer applies.
www.eldoradogold.com 21
for gold producers)
WTO standards
www.eldoradogold.com 22
Approval by MOFCOM Approval by MOLAR
Approval by NDRC and Environmental Protection Agency Approval by MOLAR
Approval by MOLAR Various permits required (safety, environmental, etc)
Operation checked against feasibility study (various agencies)
www.eldoradogold.com
eas b ty study ( a ous age c es) MIIT
23
2003 Signed an agreement with the China National Gold Group Corporation (“CNGC”) for the exclusive right to review their portfolio of operating mines, development projects and exploration projects for a period of 5 months that was later expanded to include joint reviews of other identified for a period of 5 months that was later expanded to include joint reviews of other identified
2005 Acquired Afcan Mining Corporation and the Tanjianshan gold project. 2007 Commenced commercial production at Tanjianshan mine 2007 Commenced commercial production at Tanjianshan mine. 2009 Successfully completed sulphide circuit and roaster commission at Tanjianshan mine. Discovered a new zone of gold mineralization at Tanjianshan. Acquired Sino Gold and the Jinfeng gold mine White Mountain gold mine and Eastern Dragon Acquired Sino Gold and the Jinfeng gold mine, White Mountain gold mine and Eastern Dragon gold-silver project.
www.eldoradogold.com 24
www.eldoradogold.com 25
1. Generative initiatives:
p y q
2. Early stage exploration projects:
3. Resource delineation projects:
Advanced exploration and minesite
4. Selected Accretive Acquisitions:
www.eldoradogold.com
26
Generative Exploration: $1.0 M
Other Exploration Expenses: $1.0 M Project generation and acquisition Eastern Dragon District: $2.4 M
S ji f JV White Mountain District: $2.5 M
Tanjianshan District: $3.8 M
p g
323 zone
Jinfeng District: $2.5 M Minesite drilling
www.eldoradogold.com
27
V.P. Exploration (Vancouver)
Peter Lewis
Director of Geology and New Projects, China China
Yumin Qiu
Exploration Manager, Tanjianshan Exploration Manager, Jinfeng Exploration Manager, White Mountain Exploration Manager, Eastern Dragon Exploration Manager, Generative Programs
www.eldoradogold.com
Jozef Story Wenbin Chen Mandy Yao Xingong Ou
Programs
Wang Shan
28
gold deposits
mines (Jinfeng, Zimudang, Shuiyindong Yata) Shuiyindong, Yata)
Sh i i d g 16 g /t
www.eldoradogold.com
29
Fault Controlled Ore Fault Controlled Ore Stratabound Ore
www.eldoradogold.com 30
Budget: $2.5 M
1 mining license
controlled, high grade targets (2.25m @ 19.24 gm/t in trenches)
Laizhishan Dome
www.eldoradogold.com
1 exploration license (95 km )
margin of Laizhishan Dome
31
www.eldoradogold.com 32
strike to northeast
T g t d fi iti g h i l g l gi l g
Xiaoshiren Exploration License (26 km )
www.eldoradogold.com 33
District Exploration 2010 Budget: 2010 Budget: $2.4 M
(~100 km2)
little previous exploration
153.5g/t Au / 1340 g/t Ag 119.0g/t Au /743 g/t Ag
www.eldoradogold.com 34
N1-2s
26.8 gpt Au 15.0 gpt Au EL 53
4.5 gpt Au
5.7 gpt Au 5.1 gpt Au
Lode5
1000m
9.6 gpt Au 7.7 gpt Au
N1-2s
jyLower Pleistocene Basalt Tertiary sandy conglomerate Yanshanian sub-volcanic breccia Cretaceous andesite, rhyolite Yanshanian alkali granite Mining License
92.1 gpt Au
www.eldoradogold.com
tf
3-2 jy
Interpreted Fault g Late Indosinian c-alkali granite Caledonian biotite granite
35
Budget: $3.8M
M i
www.eldoradogold.com 36
Eastern Dragon
Altay Shan
B k hik Eastern Dragon
HLJ-Jilin epithermal & breccia pipe/porphyry Au Altay Shan
Bakyrchik Kumtor
Tianshan orogenic & porphyry Au
White Mountain
pipe/porphyry Au
Kumtor Muruntau Tanjianshan
Pulang orogenic &
Jinfeng
porphyry Au-Cu
www.eldoradogold.com
Jinfeng
Golden Triangle Carlin type Au
37
Generative Exploration: $1.7 M
Other Exploration Expenses: $1.1 M Kişladağ: $4.0 M
drilling AS porphyry target: $0.9 M
Efemçukuru: $1.5 M
vein targets drilling MH project: $2.0 M
Konya-Sizma prospect: $0.4 M Sayaçik porphyry target: $0.8 M
www.eldoradogold.com
y p p $
anomalies
38
defining additional resources contiguous with present reserve
As of June 30, 2010, measured and indicated gold resources increased by 0.85 million ounces to 11.12 million ounces and inferred resources increased by 0.82 million ounces to 3.77 million
illi f g ld million ounces of gold. Proven and probable gold reserves increased by 0.98 ounces to 7.79 million ounces.
www.eldoradogold.com 39
Budget: $1.5 M K t B l i th t
Northwest Extension Northwest Extension Target Target
stepout
3.7m @ 11.1 gm/t Au
www.eldoradogold.com 40
2009 exploration program AS Au-Cu Porphyry Sayaçik
www.eldoradogold.com 41
geophysical / geochemical / geological programs
Konya-Sizma
www.eldoradogold.com www.eldoradogold.com 42 42
www.eldoradogold.com www.eldoradogold.com 43 43
$3.5 M
Cathedral Well Richmond Mtn. Buffalo Canyon Well Green Monster Canyon.
www.eldoradogold.com 44
Buffalo Canyon Green Monster
Richmond Mountain Cathedral Well
www.eldoradogold.com
Buffalo Canyon Cathedral Well
45