Effects of pH control agents and values on magnetite deposition on - - PDF document

effects of ph control agents and values on magnetite
SMART_READER_LITE
LIVE PREVIEW

Effects of pH control agents and values on magnetite deposition on - - PDF document

Transactions of the Korean Nuclear Society Virtual Spring Meeting July 9-10, 2020 Effects of pH control agents and values on magnetite deposition on Alloy 690 steam generator tubes in secondary system Soon-Hyeok Jeon a, *, Ji-Min Lee a ,


slide-1
SLIDE 1

Transactions of the Korean Nuclear Society Virtual Spring Meeting July 9-10, 2020

Effects of pH control agents and values on magnetite deposition on Alloy 690 steam generator tubes in secondary system

Soon-Hyeok Jeona,*, Ji-Min Leea, Yong-Beom Leea,b, Jeoh Hana,c, Do Haeng Hura

aMaterials Safety Technology Development Division, Korea Atomic Energy Research Institute, 989-111, Daedeok-

daero, Yuseong-gu, Daejeon, 34057, Republic of Korea

bDepartment of Materials Science and Engineering, Chungnam National University, 99, Daehak-ro, Yuseong-gu,

Daejeon, 34134, Republic of Korea

cDepartment of Materials Science and Engineering, Yonsei University, 50, Yonsei-ro, Seodaemun-gu, Seoul, 03722,

Republic of Korea *Corresponding author:junsoon@kaeri.re.kr

  • 1. Introduction

In nuclear power plant, the mitigating the corrosion

  • f structural materials and maintaining the heat

exchange capability have been considered as the most crucial goal of secondary water chemistry control to improve the reliability of secondary coolant system of pressurized water reactors (PWRs) [1,2]. In particular, pH control parameters such as pH control agents and pH values are the main factors that directly affects the corrosion behavior of secondary coolant system [3]. In the viewpoint of pH values, the pH of feedwater recently elevated pH of up to 10.0 has been under consideration to decrease flow accelerated corrosion (FAC) and iron ions and magnetite transport to the steam generator (SG) in PWRs [3]. Furthermore, we then need to establish an optimal pH control agent by considering the many related issues including secondary system materials corrosion, maintenance cost, and stability [2]. Representative two pH control agents (ammonia and ethanolamine (ETA)) are widely used to control pH in secondary coolant water of PWRs. First, ammonia was widely used up to the 1980s due to its low cost and absence of decomposition products. However, it has now become less popular because of its high volatility and acceleration of two-phase FAC [2]. Meanwhile, ETA greatly decreases the corrosion rate of nickel-based alloys [4] and carbon steels [5]. Hence, ETA is mainly used in most PWR plants either alone or alongside other pH agents [6]. As described above, many researchers have focused

  • n the effects of pH control agent and values on the

general corrosion and FAC of secondary nuclear

  • materials. However, there has been no study on the

influence of pH adjusting agents or pH values on the magnetite deposition behavior of SG tubes in the secondary water systems of PWRs. Therefore, in this paper, the effects of two representative pH control agents (ammonia and ETA) and pH values (pH 9.0 and pH 10.0 at 25 oC) on magnetite deposition on Alloy 690 SG tube were studied using a secondary loop system. The morphology of magnetite particle was observed using a scanning electron microscope (SEM). The chemical composition and microstructure of magnetite was analyzed by using X-ray diffractometer (XRD) and SEM-energy-dispersive X-ray spectroscopy (EDS). After the chemical cleaning for deposited magnetite, the cleaning solution was then subjected to an inductively coupled plasma atomic emission spectroscopy (ICP- AES) analysis to measure the iron concentration of

  • deposits. Finally, the amount of magnetite deposits per

unit area was calculated by using the measured iron

  • content. To clarify the mechanism of magnetite

deposition behavior, zeta potential of magnetite and surface zeta potential of Alloy 690 were measured in secondary water at room temperature.

  • 2. Experimental methods
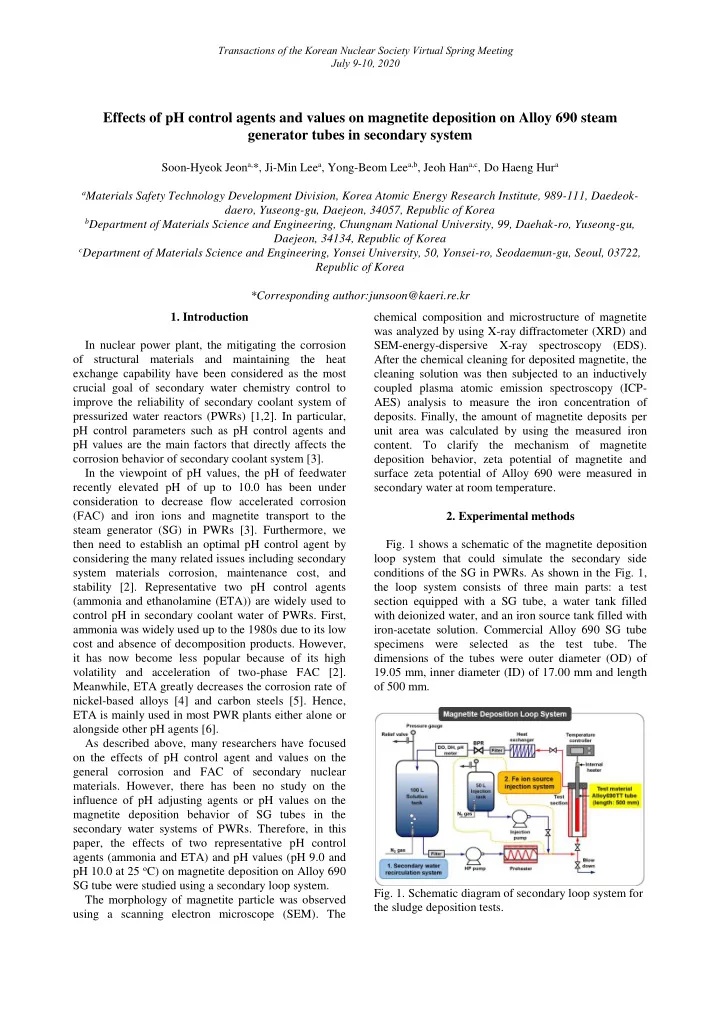
  • Fig. 1 shows a schematic of the magnetite deposition

loop system that could simulate the secondary side conditions of the SG in PWRs. As shown in the Fig. 1, the loop system consists of three main parts: a test section equipped with a SG tube, a water tank filled with deionized water, and an iron source tank filled with iron-acetate solution. Commercial Alloy 690 SG tube specimens were selected as the test tube. The dimensions of the tubes were outer diameter (OD) of 19.05 mm, inner diameter (ID) of 17.00 mm and length

  • f 500 mm.
  • Fig. 1. Schematic diagram of secondary loop system for

the sludge deposition tests.

slide-2
SLIDE 2

Transactions of the Korean Nuclear Society Virtual Spring Meeting July 9-10, 2020

In secondary loop system, the flow rate of the circulating water was maintained at 260 cc/min and the dissolved oxygen (DO) concentration was continuously maintained below 5 ppb. The pH of the circulating water was maintained at 9.0 and 10.0 by injecting diluted solutions of ammonia and ETA, and the pH value was continuously monitored using an in situ pH

  • sensor. The pressure of test section was then gradually

increased to 60 bar by the BPR, and the water temperature near the specimen surface was maintained at 270 oC to maintain subcooled nucleate boiling conditions by operating the pre-heater, ceramic heaters surrounding the test section, and the internal heater inside the SG tube specimen. The heat flux of the internal heater was maintained at about 30 W/cm2. After these test conditions were set, we injected the iron ions into the test section through the metering injection pump with a flow rate of 1 ml/min from the source injection tank. The precursor solution was diluted in the simulated secondary water stream and its final concentration was calculated as 1 ppm Fe in the test section. Each deposition test was performed for 14 days. After performing the magnetite deposition tests, the SG tube specimens were cut into tubular segments for the measurement of magnetite mass and microstructural analysis of the magnetite. To evaluate the amount of magnetite, two tubular segments of about 20 mm in length at different axial locations were immersed separately in a chemical cleaning solution (20 wt.% ethylenediaminetetraacetic (EDTA) acid + 1 wt.% N2H4 + 1 wt.% corrosion inhibitor + NH4OH) at 93 oC for 12 hours to selectively dissolve the magnetite only. The dissolved solution was subjected to an ICP-AES analysis to measure the iron concentration. Finally, the amount of magnetite per unit area was calculated by using the measured iron content. The magnetite deposits were analyzed by using a focused ion beam (FIB)-SEM to observe closely the cross-section of deposits. The magnetite particle morphology, chemical composition, and deposit layer thickness were analyzed using FIB-SEM attached with an EDS. The zeta potentials of both magnetite nanoparticles and the Alloy 690TT tube surface were measured at 25

  • C. To measure the zeta potentials of the magnetite

particles, we prepared samples by dispersing 5 nm magnetite nanoparticles in deionized water at a concentration of 25 mg/l. Diluted ammonia or ETA was added to the sample, whose pH value was set at 9.0 and 10.0, and the prepared sample was transferred to a zeta potential measurement cell. After then, the Zetasizer applied an electric field to the sample through an electrode fixed to the cell. The magnetite nanoparticles moved toward the electrode depending on their charge, and the electrophoretic mobility was proportional to the intensity of the electric field and the zeta potential of the magnetite particles. By using the electrophoretic light scattering phenomena, the Zetasizer measured the electrophoretic mobility of the magnetite particles and then measured the zeta potential of particle from Henry's equation.

  • 3. Results and Discussion

3.1. Microstructural analysis of SG tube deposits

  • Fig. 2 shows the SEM micrographs of the SG tube

deposits under two pH control agents and two pH values. Under all conditions, the magnetite particles were polyhedral or spherical in shape with a size of several tens to hundreds of nanometers, which is almost similar to the actual SG tube deposits. In addition, extremely small pores were observed between the magnetite

  • particles. Based on the SEM results, at a pH of 9.0 and

10.0, the pH control agents do not seem to have a significant effect on the shape of the magnetite particles.

  • Fig. 2. SEM micrographs of the surface of magnetite

deposited onto the SG tube under various pH agents and values: (a) ETA, pH 9.0, (b) ETA, pH 10.0, (c) NH3, pH 9.0, and (d) NH3, pH 10.0.

  • Fig. 3 presents the cross-sectional FIB-SEM images
  • f the magnetite deposits depending on the pH values

(9.0 and 10.0) using ETA. Numerous micro-pores with diameter between 0.1 μm and 6 μm were clearly

  • bserved in the magnetite deposits under all pH values.

They were formed when steam bubbles escaped from the heated Alloy 690TT tube surface. The number and size of the micro-pores increased from the tube side to the water side. This result was closely related to bubble growth and chimney phenomena. As shown in Fig.3, it was difficult to check a noticeable difference in the cross-sectional shapes depending on the pH values. However, the thickness of the magnetite deposits was not same. Based on the results, the pH values do not seem to have a significant effect on the cross-sectional morphologies of the magnetite particles.

  • Fig. 4 shows the XRD patterns of magnetite

depending on the two pH agents at pH 10.0, which

slide-3
SLIDE 3

Transactions of the Korean Nuclear Society Virtual Spring Meeting July 9-10, 2020

indicate that all the diffraction peaks of the deposits were well matched with the pure magnetite XRD data (PDF No. 00-019-0629). The XRD results show that the deposits were pure magnetite regardless of the pH control agents, which shows our deposition tests well simulate that the actual sludge deposits on the secondary water of SGs are mainly composed of magnetite (about 90 ~ 95%).

  • Fig. 3. SEM micrographs of the cross-section of

magnetite deposited onto the SG tube under ETA at pH 9.0 and 10.0: (a) ETA, pH 9.0 and (b) ETA, pH 10.0.

  • Fig. 4. XRD patterns of magnetite deposits depending
  • n the pH control agents at pH 10.0. XRD results

confirm that the deposits were pure magnetite regardless

  • f the pH control agents.

3.2. The amount of magnetite deposition

  • Fig. 5 shows the amount of magnetite per unit area

deposited onto the SG tube, which indicates that the pH control agents and pH values clearly affect the amount

  • f magnetite deposits. As shown in the Fig. 5, the lowest

amount of magnetite deposits was formed when pH was controlled with ammonia at a pH of 10.0. The amount of magnetite deposits in the case of ETA at pH 10.0, compared to ammonia, increased about 2.6 times,

  • respectively. Furthermore, under all pH agents, the

amount of magnetite deposit decreased on the SG tube at pH 10.0 value compared to that on the SG tube at pH 9.0 value.

  • Fig. 5. The amount of magnetite per unit area deposited
  • nto the SG tubes depending on the pH control agents

and pH values. The analysis results of the zeta potential of magnetite and surface zeta potential of SG tubes will be performed

  • soon. These results will be discussed at the oral

presentation.

  • 4. Conclusions

(1) Under all conditions, the magnetite particles were polyhedral or spherical in shape. Numerous micro-pores were clearly observed in the deposits. The simulated magnetite deposits were almost similar to sludge collected from the real nuclear power plants. (2) The amount of magnetite deposit decreased on the SG tube at pH 10.0 value compared to that on the SG tube at pH 9.0 value regardless of pH control agents. In addition, the amount of magnetite deposition increased approximately 2.6 times in the case of ETA at pH 10.0, respectively, compared to ammonia at pH 10.0. Based

  • n the results, ammonia at pH 10.0 is the most

beneficial pH conditions in the viewpoint of magnetite deposition mitigation in SG. Acknowledgement

This work was supported by the National Research Foundation (NRF) grant of the Republic of Korea funded by the Korean government (NRF-2017M2A8A4015159).

slide-4
SLIDE 4

Transactions of the Korean Nuclear Society Virtual Spring Meeting July 9-10, 2020

REFERENCES [1] H.Kawamura, Y. Shoda, T. Terachi, Y. Katsumura,

  • S. Uchidae, T. Mizunof, Y. Muroya, Y. Tsuzuki, R.

Umeharai, H. Hirano, T. Nishimura, PWR secondary water chemistry guidelines in Japan - Purpose and technical background, Progress in Nuclear Energy 114, 121-137, 2019. [2] F. Nordmann, J.-M. Fiquet, Selection criteria for the best secondary water chemistry, Nucl. Eng. Des. 160, 193-201, 1996. [3] C. Marks, Steam Generator Management Program: Effects of Different pH Control Agents on Pressurized Water Reactor Plant Systems and Components, EPRI, Palo Alto, CA, USA (EPRI report 1019042), 2009. [4] J. Wang, J. Wang, Influence of Ethanolamine on Corrosion of Alloy 690 in Simulated Secondary Water, Journal of Materials Science & Technology 31, 1039- 1046, 2015. [5] I.H. Rhee, H. Jung, D. Cho, Evaluation of pH control agents influencing on corrosion of carbon steel in secondary water chemistry condition of pressurized water rector, Nucl. Eng. Technol. 46, 431-438, 2014. [6] A. Drexler, Steam-water cycle chemistry relevant to nuclear steam generators, in: Steam Generators for Nuclear Power Plants, Chap. 6, Woodhead Publishing, 2017.