
SLIDE 1
Economic Spillover Effect
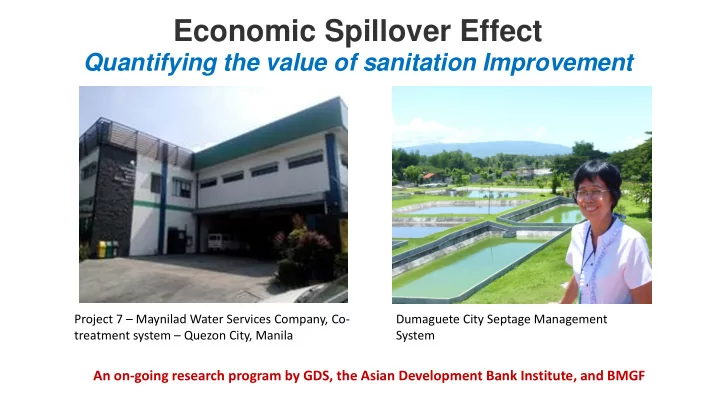
Quantifying the value of sanitation Improvement
Project 7 – Maynilad Water Services Company, Co- treatment system – Quezon City, Manila Dumaguete City Septage Management System
Economic Spillover Effect Quantifying the value of sanitation - - PowerPoint PPT Presentation
Economic Spillover Effect Quantifying the value of sanitation Improvement Project 7 Maynilad Water Services Company, Co- Dumaguete City Septage Management treatment system Quezon City, Manila System An on-going research program by GDS,
Project 7 – Maynilad Water Services Company, Co- treatment system – Quezon City, Manila Dumaguete City Septage Management System
Reference: World Bank 2008
Type of Business 2010 2011 2012 2013 2014 2015 2016 2017 % Annual Increase Population 120,883 131,377 Banks and other financial institutions 239 248 244 322 339 361 372 396 8 Caterers and food establishments 570 632 605 685 640 667 684 740 4 Manufacturing 150 150 138 152 153 165 157 166 1 Printing and publications 13 17 16 15 14 14 14 18 5 Real estate lessors 390 427 450 531 555 603 649 697 10 Retailers 1,676 2,632 2,500 2,748 2,730 2,858 2,887 3,102 10 Services 1,113 1,128 1,154 1,282 1,290 1,383 1,426 1,519 5 Wholesale/ distribution 164 179 170 197 207 201 201 190 2 Exempted business entities 49 195 87 196 171 79 114 134 22 Other impositions/ fixed taxes No data No data 2,344 2,516 2,430 2,490 2,470 2,578 Total 4,364 5,608 7,708 8,645 8,530 8,821 8,974 9,450 15
The spillover effect for their FSM program shows that 1.86% of economic growth per year can be attributed to FSM. For real estate valuations, that is $465,000 per year for every $25 million value.
CAPX
Savings from program efficiency Property values Property taxes Livelihood Health Economic Development
CAPEX and OPEX Internal effect savings Spillover effect costs or benefits
________________
OPEX
________________
CAPX CAPEX and OPEX
Property taxes Livelihood Health Economic Development
Spillover effect costs or benefits
Property taxes Livelihood
https://drive.google.com/file/d/1CM3GC-1KByPwFMysimC9mRwROqs5FRZX/view?usp=sharing https://drive.google.com/file/d/1CM3GC-1KByPwFMysimC9mRwROqs5FRZX/view?usp=sharing
For more information email at: dmrobbins10@gmail.com