
SLIDE 1
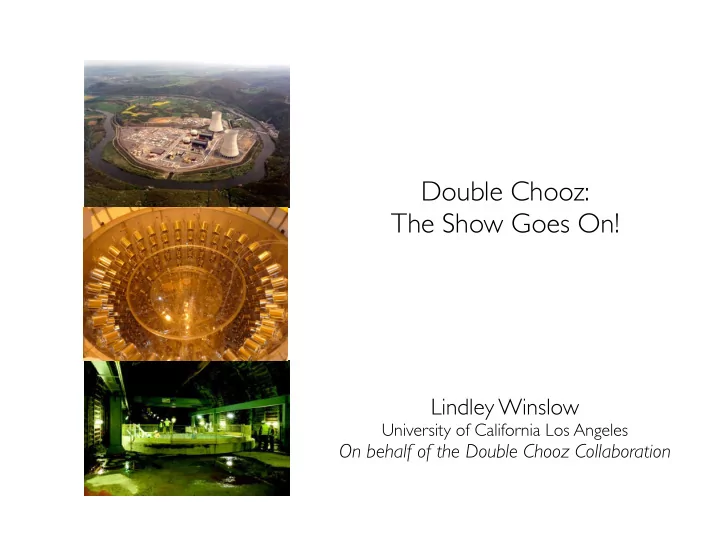
Double Chooz: The Show Goes On!
Lindley Winslow
University of California Los AngelesOn behalf of the Double Chooz Collaboration
Double Chooz: The Show Goes On! Lindley Winslow University of - - PowerPoint PPT Presentation
Double Chooz: The Show Goes On! Lindley Winslow University of California Los Angeles On behalf of the Double Chooz Collaboration The Double Chooz Collaboration: France Germany Japan Russia Spain USA Brazil CBPF APC
Double Chooz: The Show Goes On!
Lindley Winslow
University of California Los AngelesOn behalf of the Double Chooz Collaboration
The Double Chooz Collaboration:
Brazil CBPF UNICAMP UFABC France APC CEA/DSM/ IRFU: SPP SPhN SEDI SIS SENAC CNRS/IN2P3: Subatech IPHC Germany EKU Tübingen MPIK Heidelberg RWTH Aachen TU München Theory favored small sin22θ13!
Theory Order of Magnitude Prediction Le-Lμ-Lτ 0.00001 SO(3) 0.00001 S3 and S4 0.001 A4 Tetrahedral 0.001 Texture Zero 0.001 RH Dominance 0.01 SO(10) with Sym/Antisym Contributions 0.01 SO(10) with lopsided masses 0.1
Limit as
Model Review by Albright et. al. ArXiv:0803.4176
Reactor Experiment Design Neutrino Factory Designs
Measuring the last mixing angle:
Measuring the last mixing angle:
Remember: We are looking for an effect as a function of L/E.
Construction Underway!
Double Chooz Analysis is Unique:
➙Detailed Energy Response Model
➙ Multiple analysis periods.
➙Detailed Reactor Model
Reactor Basics θ13 is Large! The Future
νe
Reactors Produce a lot of antineutrinos!
2×10²⁰ νe per s per GWth
235U
νe νe νe
235U
140Xe 140Cs 140Ba 140Laνe
140Ceνe
94Srνe
94Y 94ZrAn Example Fission:
Spectra per Fission ×
Obtaining the Neutrino Prediction:
Reactor core simulated with detailed inputs from the power company.
Fission Rates
Measured at devoted experiment at the ILL research reactor.
Fuel is arranged in assemblies. UO2 Fuel
Nuclear Reactor Basics
Fuel Assembly
We concentrate on SF97.
Takahama Benchmark
Published information of the irradiation history of fuel rods installed in a PWR
at the end of three fuel cycles. Fuel Assembly top 0m bottom 3.6m 0.16 m 0.35 m 0.6 m 1.8 m 3.5m 2.9 m
Six samples were taken along the rod. Fuel Rod SF97
Result of Takahama Benchmark for 235U:
Simulations agree with measurements and other codes within the uncertainties of the simulations’ inputs.
Spectra per Fission ×
Obtaining the Neutrino Prediction:
Reactor core simulated with detailed inputs from the power company.
Fission Rates
Measured at devoted experiment at the ILL research reactor.
Average Cross Section per Fission: Fractional Fission Rates
235U
0.496±0.016
239Pu
0.351±0.013
238U
0.087±0.006
241Pu
0.066±0.007
Normalization to Bugey-4:
The experiment with the smallest uncertainty, 1.4%.
Normalization to Bugey-4:
p
The Signal: Inverse Beta Decay
¯ νe
p n e+ Event #1 Ee = Eν - 0.8MeV Event #2 Eγ~8 MeV
30μsGd
7m 7m Target 10.3 m3 (8 tons) Gd Doped Scintillator Gamma Catcher 22.3 m3 Plain Scintillator Buffer 110 m3 Mineral Oil with 390 10” PMTs
Inner Veto 90 m3 LAB Scintillator with 78 8” PMTs 7m 7m
Outer Veto Precision muon tracking with plastic scintillator readout with fibers and multi- anode PMTs. 7m 7m
7m 7m Calibration Systems
Last November’s Result: (DC1stPub)
New Result: Double the Statistics! Improved Systematics!
Keep your eye on the ArXiv!
Selecting Antineutrino Coincidence:
Event #1
Event #2
2 μs < Δt < 100 μs time
Selecting Antineutrinos General:
p n
muon event (> 600 MeV deposited).
These are new and reduce muon related backgrounds!
Data taking time (days)
50 100 150 200 250 300 350Data taking efficiency
0.2 0.4 0.6 0.8 1 2011 Jul. 2011 Oct. 2012 Jan. 2012 Apr.Data taking time (days)
50 100 150 200 250 300 350 Double Chooz (prel.) Total 1st result 2nd resultCollecting Data Since April 13, 2011... We see 8249 neutrino candidates in 227.9 live days.
Remember: Reactor Experiments are antineutrino disappearance experiments.
➜Background subtraction is key.
Neutrons Neutrons Neutrons
Neutrons Neutrons Neutrons
n
Some Basic Diagrams:
Target Veto Rock
μ
These neutrons we can veto...
Rock Veto
μ
Muons Passing through the Rock: These create two kinds of backgrounds: accidental and fast neutron.
Rock Veto
Accidental Coincidences: R = 0.261±0.002 events per day
E (MeV) 2 4 6 8 10 12 Entries / 200 keV 1 10 2 10 3 10 Singles scaled Accidental prompt Fast Neutron and Stopped Muons: R = 0.67±0.20 events per day
Prompt Event energy extends beyond reactor antineutrino spectrum. Fast neutrons are attenuated the center
stopped muons come down the chimney.
μ
These are very problematic... In addition to neutrons, muons can produce light isotopes. 9Li and
8He decay through β-delayed neutron emission.Rock Veto
R = 1.25 ± 0.54 events per day after muon vetoes. Without the high energy muon veto would have been R = 2.05+0.62 -0.52 events per day.
Time to >600 MeV deposited Muon Background Subtracted Energy Spectrum
9Li
1.25±0.54
Fast-N + Stopped Muons
0.67±0.20 Accidental 0.261±0.002 Total 2.13±0.58 Candidates 36.2
Background Summary:
We have 1.6% uncertainty due to the backgrounds, but they can be constrained in a Rate + Shape analysis.
Events per Day
μ
Statistics 1.1% (1.6%) Reactor 1.7% Backgrounds 1.6% (3.0%) Detector 1.0% (2.1%) (compare to DC1stPub)
Energy Scale Improvements:
LED calibration system used to correct electronics non-linearity, and neutron capture maps to correct position dependence.
Example Prediction:
No Oscillation sin22θ13=0.2
This analysis uses rates, energy information and two periods (1 reactor and 2 reactor).
Rate Only: sin22θ13 = 0.170 ± 0.035(stat) ± 0.040(sys)
Rate + Shape sin22θ13 = 0.109±0.030(stat)±0.025(sys) χ2/NDF = 42.1/35 sin22θ13 > 0 at 3.1σ !
Examining all of the data together.
Moving Forward!
Continued Analysis Work:
Now up to 8 days with both reactors off. Did I mention we get two Reactor Off Data?
After analyis cuts in 6.84 days of live time
Nice agreement with 12.8±2.2 predicted for this period.
Test Result Stability in Time.... And look for Lorentz Violation. Lorentz violation in the neutrino sector implies the universe has a preferred direction. You can look for its effect by examining the
function of sidereal time. Strong limits for νe➙ νμ and νμ➙ ντ; however, there is an
See Kostelecký and Mewes PRD70(2004)076002
Test Energy Response and Background Levels.... ...and look for Double Beta Decay.
160Gd is a double beta decay candidate with an endpoint of 1.72background levels, especially those from U/Th are not too high.
Energy (MeV) 1 10U n d e r C
s t r u c t i
!
Near Detector Under Construction:
Completed by the end of 2013.
Conclusions:
rate and shape analysis with improved statistics and systematics.
null oscillation hypothesis at 99.9% (3.1σ).
reactor configuration allows for unique analyses.
The Chooz Goes On!
More Slides
1956 1999 2002
Poltergeist Chooz KamLAND
A long history of reactor experiments...
The Re-Analysis of the Spectra: All the experiments are now low.
sin22θ13 = 0.06 See Phys.Rev. D83 (2011) 073006 The Re-Analysis of the Spectra: Sterile Neutrino at ~1eV2?
sin22θ13 = 0.06 See Phys.Rev. D83 (2011) 073006