
SLIDE 1
21
Doji
28 4 February 11 19 25 4 March 11 18 25 1 April 8 15 37.0 37.5 38.0 38.5 39.0 39.5 40.0 40.5 41.0 41.5 42.0 42.5 TJX
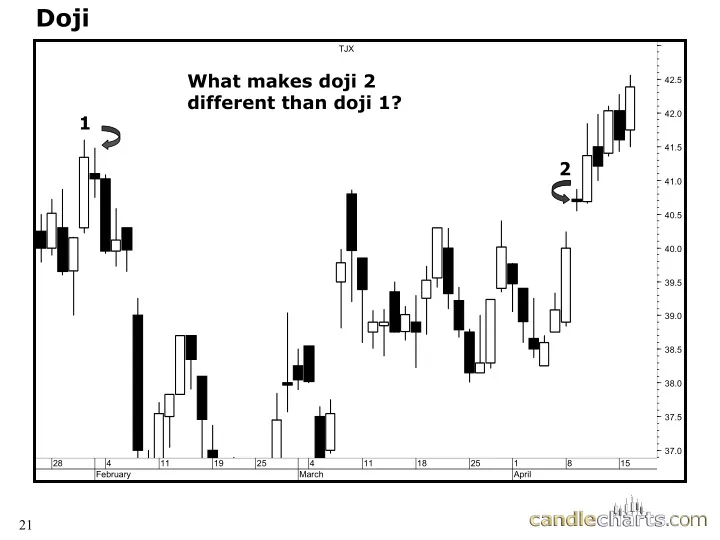
1 2 What makes doji 2 different than doji 1?
Doji TJX What makes doji 2 42.5 different than doji 1? 42.0 1 - - PowerPoint PPT Presentation
Doji TJX What makes doji 2 42.5 different than doji 1? 42.0 1 41.5 2 41.0 40.5 40.0 39.5 39.0 38.5 38.0 37.5 37.0 28 4 11 19 25 4 11 18 25 1 8 15 February March April 21 Trading Tactics Trading Tactics 1) Name
21
Doji
28 4 February 11 19 25 4 March 11 18 25 1 April 8 15 37.0 37.5 38.0 38.5 39.0 39.5 40.0 40.5 41.0 41.5 42.0 42.5 TJX
1 2 What makes doji 2 different than doji 1?
Trading Tactics Trading Tactics
1) Name the two reversal signals at the arrows. 2) Would you use these signals to sell short? Liquidate longs? Why? 3) What is bearish confirmation of the reversal signals?
22
23
Criteria: Use the highest high of those two sessions (top of upper shadow) as resistance Implication: Close over that area: market is “refreshed”
24
Doji
The red arrows show the bulls have complete
session alters the trend (note also the spinning tops in mid and late June).
25
Small Real Body as a doji
26
Doji after tall white
27
Doji as Resistance
Trading Tactics Trading Tactics -
Doji
Analyze these doji in the context of what happened
A -1 B-2 C-3
28
Trading Tactics Trading Tactics – – Doji (answer) Doji (answer)
Rally may just be starting Market not
Resistance confirmed by doji
A-1 B-2 C-3
Analyze these doji in the context of what happened
29
Doji Overview Doji Overview – – Analyze Each Doji in Context of Trend Analyze Each Doji in Context of Trend
15 22 29 5 August 12 19 26 3 September 9 16 23 13.5 14.0 14.5 15.0 15.5 16.0 16.5 17.0 17.5 18.0 18.5 19.0 19.5 20.0 20.5 HEIDRICK STRUGG
1 2 3 4 5 6
30
Remember: location and size of the shadow should be considered when analyzing the market psychology. Implication: Bearish long upper shadow offsets “rallying strength.” Bullish long lower shadows hints bears losing force.
31
32
Upper Shadows and slope of advance
Scenario 1 Scenario 2
The Tools of the West with the The Tools of the West with the Light of the Candles Light of the Candles
33
black or white
Criteria:
Implication: ‘Groping for a bottom”
34
black or white black or white
35
Criteria: very long shadows and lower small real body - color not important Implication: Trend is losing force
36
High Wave Candle
Who’s in Charge? Who’s in Charge Now?
37
High Wave Candle
New High Close,but??
38
Criteria: very long shadows and lower small real body - color not important Implication: “Market has lost it’s sense
39
High-wave candle
RDY The market is at a new high- but the high wave candle shows the bulls are not in full control.
40