Discovery and Exploration of the WOODJAM Copper-Gold-Molybdenum - - PowerPoint PPT Presentation

discovery and exploration of the woodjam copper gold
SMART_READER_LITE
LIVE PREVIEW

Discovery and Exploration of the WOODJAM Copper-Gold-Molybdenum - - PowerPoint PPT Presentation

Discovery and Exploration of the WOODJAM Copper-Gold-Molybdenum Project, British Columbia Southeast Zone NWMA, Reno/Sparks, Nevada November 30, 2011 Presented by: Tom Schroeter Forward Looking Statements Consolidated Woodjam Copper Corp has


slide-1
SLIDE 1

Discovery and Exploration of the WOODJAM Copper-Gold-Molybdenum Project, British Columbia

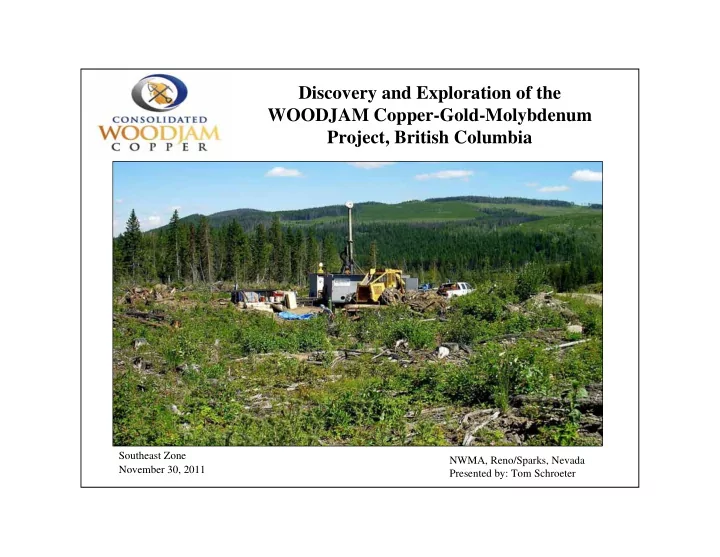
November 30, 2011 Southeast Zone NWMA, Reno/Sparks, Nevada Presented by: Tom Schroeter

slide-2
SLIDE 2

Forward Looking Statements

Consolidated Woodjam Copper Corp has taken all reasonable care in producing and publishing information contained on this presentation. Material may still contain technical or other inaccuracies, omissions, or typographical errors, for which Consolidated Woodjam assumes no

  • responsibility. Consolidated Woodjam does not warrant or make any representations regarding the

use, validity, accuracy, completeness or reliability of any claims, statements or information on this site. Under no circumstances, including, but not limited to, negligence, shall Consolidated Woodjam be liable for any direct, indirect, special, incidental, consequential, or other damages, including but not limited to, loss of programs, loss of data, loss of use of computer of other systems, or loss of profits, whether or not advised of the possibility of damage, arising from your use, or inability to use, the material on this site. The information is not a substitute for independent professional advice before making any investment decisions. Furthermore, you may not modify or reproduce in any form, electronic or otherwise, any information on this site, except for personal use unless you have

  • btained our express permission.

This presentation may contain forward-looking statements, including but not limited to comments regarding predictions and projections. Forward-looking statements address future events and conditions and therefore involve inherent risks and uncertainties. Actual results may differ materially from those currently anticipated in such statements.

slide-3
SLIDE 3

Exploring BC’s Prolific Quesnel Terrane Copper–Gold Porphyry Belt

slide-4
SLIDE 4

Woodjam Copper Corporate Summary

  • Common Shares TSX-V: WCC
  • Shares Issued : 49,999,984
  • Options: TBD
  • Cash Position: $150,000
  • Listing Date: November 30, 2011
  • Predecessor Companies (Former Woodjam JV):

– Fjordland Exploration Inc. (TSX-V: FEX) – Cariboo Rose Resources Ltd. (TSX-V: CRB)

slide-5
SLIDE 5

About Gold Fields

  • One of world’s largest unhedged producers of gold
  • Attributable annual production of 3.5 M oz Au from 8 mines

in Peru, South Africa, Ghana and Australia (target = 5 Moz by 2015)

  • Total attributable reserves of 77 M oz Au and resources
  • f 225 M oz Au
  • Operating under Gold Fields Horsefly Exploration Corp
slide-6
SLIDE 6

Woodjam Property “Heart of the Cariboo”

slide-7
SLIDE 7

Woodjam Property Geology

Woodjam North Woodjam South

Core Area

slide-8
SLIDE 8

Woodjam 2009 Magnetics Airborne (RTP-TF)

Woodjam North Woodjam South

Core Area

slide-9
SLIDE 9

Woodjam – Infrastructure

  • Flat to rolling topography
  • Active logging area creating new access routes
  • Moderate climate; snow free from April to November
  • Existing BC power line corridor for several kilometres
  • Resource friendly country: Mining/exploration – logging – cattle ranching
slide-10
SLIDE 10

Exploration Drilling History (45 years)

YEAR OWNER/OPERATOR DRILLING COMMENTS 1966-1967 Helicon Expl`n/Magnum Cons.

  • 1973-1977

Exploram Minerals 6 holes - 1,056 m 1983 Archer Cathro + Assoc

  • 1983-1984

Placer Development 17 holes - 1,266 m Some holes very shallow (never reached bedrock) 1984 Archer Cathro & Assoc.

  • 1986

Big Rock Gold

  • 1987

Archer Cathro & Assoc.

  • 1990

Auspex Gold

  • 1991-1992

Noranda Exploration

  • Late 1992 - Noranda closed its BC office (terminated option)

1998 Wildrose Resources

  • Property Consolidation

1999 Phelps Dodge Corp. 4 holes - 767 m Phelps Dodge withdrew for corporate reasons 2001-2008 Fjordland Exploration Inc/Cariboo Rose Resources Ltd. 84 holes - 26,342 m New discoveries: Southeast and Deerhorn Zones 2009 Gold Fields Horsefly 14 holes ~ 4,583 m First year of Option Agreement (Takom/Deerhorn Zones) 2010 Gold Fields Horsefly 75 holes ~ 21,908 m Woodjam North and South (3rd largest drill program in BC) 2011 Gold Fields Horsefly 85 holes ~ 30,000 m Woodjam North and South TOTAL 285 holes – 85,922 m

slide-11
SLIDE 11

Age Dates

Zone Host Rock Mineral Method Approx Date Southeast Quartz Monzonite Molybdenum Re/Os 196.9 ± 0.9 Ma Southeast Hbld-Bio-Gr Diorite Zircon U-Pb 196.9 ± 0.3 Ma Takom Quartz Monzonite Hornblende Ar/Ar 193.0 ± 1.2 Ma Takom Quartz Monzonite K-spar Ar/Ar 192.2 ± 1.1 Ma Megabuck Post min dyke Biotite Ar/Ar 163.6 ± 0.84 Ma Other Dates (Active or Former Producers

  • Gibraltar:

204 to 217 Ma

  • Highland Valley Copper:

208 to 212 Ma

  • Boss Mountain:

102 ± 4 Ma

  • Mount Polley:

205.2 ± 1.2 Ma

  • Kemess:

202 Ma

slide-12
SLIDE 12

IP (Chargeability) Magnetics (TF)

Core Area Geophysics

slide-13
SLIDE 13

Airborne Magnetics + Drilling Compilation

slide-14
SLIDE 14

IP Chargeability

(Projected to 200m)

+ Drilling Compilation

slide-15
SLIDE 15

Drilling + 2011 Grade Shell Compilation

* Cu @ US$6,800/t Au @ US1100/oz Mo not included

Megabuck East Area

slide-16
SLIDE 16

Woodjam South

  • 13,827 ha
  • Southeast Zone
  • Prospective

Mag “Corridor”

slide-17
SLIDE 17

Gold Fields Option – Woodjam South

  • Option and Joint Venture Agreement with Gold Fields Horsefly Exploration Corp

(member of the Gold Fields Limited group of companies (NYSE:GFI) – May 20, 2010)

  • GF can earn up to a 70% interest in “South” portion (13,827 ha) of Woodjam Property

[US$15M over 7.5 year term + Can$500,000 worth of Fjordland + Cariboo Rose shares + feasibility study].

  • GF may earn an initial 51% interest by spending US$7M in exploration over 3.5 years, with a

minimum expenditure of US$2M in the first 18 months. In addition, GF completed private placement in mid-Aug 2010 for Can$300,000 and $200,000 worth of Fjordland and Cariboo Rose common shares respectively.

  • GF may extend option to earn a further 19% interest by spending a further minimum of US$2M on

the property for each of the first 4 years of the second option period.

  • GF must complete a comprehensive “feasibility study” of all known targets or deposits in the

property.

  • Consolidated Woodjam Copper Corporation is the operator of the project while GF will provide

technical direction.

slide-18
SLIDE 18

Southeast Zone

Drill Summary + IP

slide-19
SLIDE 19

Southeast Zone

(looking west)

IP Anomaly

(1.5x1.0 km)

slide-20
SLIDE 20

Southeast Zone

  • New Porphyry Cu-Au-Mo Discovery – Nov 2007. Selected by Research Capital (Jan

21, 2009) as one of the 12 “Most Exciting New Discoveries in the Last 3-year Cycle in the World” [The Drillers Dozen]

  • Target Area (IP Chargeability): 1.5 x 1.0 km
  • To end 2011: 80 drill holes – 31,740 m (includes 42 holes totaling 17,195 m in 2011)
  • Drill tested core area 1,000 m (length), 800 m (width), 400 to 450 m (depth)
  • Most holes mineralized from bedrock surface to bottoms of holes
slide-21
SLIDE 21

Woodjam Southeast Zone Drilling Grade Shells

slide-22
SLIDE 22

Southeast Zone X-Section A-A’

slide-23
SLIDE 23

Southeast Zone Significant High- Grade Intersections

Gibraltar Mine – Reserves (P+P): 727.1 Mt @ 0.305% Cu, 0.008% Mo Resource (M+I): 861.9 Mt @ 0.300% Cu, 0.008% Mo (Metal Prices: Cu=US$2.25, Mo=$14/lb) Total Cash Costs of Production – 1 lb Cu = US$1.70

Hole No. Interval (m) % Cu % Mo g/t Au Cu Eq 07-79 207.5 0.34 0.014 0.05 0.64 08-83 402.0 0.44 0.006 0.08 0.47 08-84 359.1 0.69 0.006 0.27 0.84 including 200.8 1.01 0.004 0.44 1.26 08-88 221.6 0.46 0.013 0.05 0.57 10-14 243.8 0.50 0.015 0.04 0.61 including 163.9 0.63 0.017 0.04 0.75 11-25 272.2 0.42

  • 0.14

0.52 11-29 264.0 0.41 0.010 0.12 0.53 including 35.7 0.83

  • 0.30

1.02 11-33 171.3 0.49 0.004 0.08 0.56 11-34 296.9 0.47 0.016 0.06 0.62 11-51 315.8 0.40 0.020 0.04 0.55

slide-24
SLIDE 24

Interval (m) % Cu % Mo Au g/t 359.1 0.69 0.006 0.27

including

200.8 1.01 0.002 0.44

including

51.0 1.61 0.004 0.84

including

27.0 1.96 0.0003 1.33

including

6.5 3.23 0.0002 2.38

Southeast Zone Hole 08-84

* Mount Polley Mine – Green Zone : 25.1 m @ 4.43% Cu, 1.28g/t Au, 26.9 g/t Ag

slide-25
SLIDE 25

08-83 (190.3 m) 0.99% Cu, 0.114% Mo, 0.006 g/t Au 08-83 (228 m) 1.34% Cu, 0.003% Mo, 0.15 g/t Au 08-83 (508.3m) 2.10% Cu, 0.002% Mo, 0.29 g/t Au 08-84 (225.5m) 1.58% Cu, 0.003% Mo, 0.49 g/t Au

slide-26
SLIDE 26

Woodjam North

  • 42,343 ha
  • 4 Zones

Megabuck Takom Deerhorn Tisdall

  • Prospective

“Mag High Corridor”

slide-27
SLIDE 27

Gold Fields Option – Woodjam North

  • Option and Joint Venture Agreement with Gold Fields Horsefly

Exploration Corp (a member of the Gold Fields Limited group of companies (NYSE:GFI) – July 29, 2009

  • GF can earn up to 70% interest in “North” portion (42,343 ha) of

Woodjam Property.

  • GF may earn an initial 51% interest by spending $7 M in exploration

and making $350 K in cash payments to Woodjam JV over 3 years, with minimum expenditure of $1 M in first year ($3M planned).

  • GF may extend option to earn a further 19% interest by funding a further

$12 M over 4 years (i.e. $19 million total)

slide-28
SLIDE 28

Megabuck + Megabuck East Zones

IP Chargeability Background

slide-29
SLIDE 29

Hole No. Interval (m) % Cu Au g/t 74-01 87.6 0.13 1.24 99-20 41.6 0.13 0.98 04-32 274.9 0.14 1.03 04-37 348.0 0.12 0.82 06-51 93.6 0.19 0.95 06-53 28.0 0.24 1.52

Megabuck Zone

* Kemess South – Original Resources (1998): 202 Mt @ 0.224% Cu, 0.63g/t Au

  • 70 holes drilled (18,087 m) – 22 historic, 48 since 2002
  • 150 m wide x 225 m long mineralized envelope outlined (dipping 65° SE) containing

quartz-chalcopyrite-magnetite stockworks in monzonite intrusives and volcanics

  • 2011: 4 ddh = 1,209 m (incl. metallurgical testing and geological modeling)
slide-30
SLIDE 30

Megabuck Zone Drilling

05-47 (257 m) 0.34% Cu, 1.72 g/t Au

slide-31
SLIDE 31

Deerhorn Zone Drillholes

IP Chargeability Background

slide-32
SLIDE 32

Deerhorn Zone Geology

slide-33
SLIDE 33

Deerhorn Zone X-Section

slide-34
SLIDE 34

Hole No. Interval (m) % Cu Au g/t Au Eq g/t 10-09 90.8 0.39 0.58 0.67 10-21 141.5 0.30 1.24 1.78 10-23 95.7 0.22 0.53 0.92 11-26 151.5 0.21 0.83 1.20 including 68.8 0.35 1.17 1.80 including 37.0 0.25 1.81 2.27 11-30 160.3 0.25 1.03 1.47 including 52.0 0.40 1.73 2.45 11-32 207.5 0.18 1.00 1.32 including 90.0 0.29 1.90 2.42

  • Original 1500 x 650 m IP

Chargeability/Magnetic geophysical target

  • Quartz-chalcopyrite-magnetite

stockworks similar in character to Megabuck mineralization.

  • Main mineralization traced over length
  • f 350 m, width of 100 m and to 200 m in

depth; open in all directions.

  • Mineralization (64° steeply dipping to

SE) traced over length of ~700 m in a second upper zone.

  • 2011: 11 ddh = 2,867 m )incl

metallurgical testing and geological modelling).

  • Total to date: 43 ddh totaling 10,403 m.

Deerhorn Zone – 2008 Discovery

slide-35
SLIDE 35

Deerhorn Zone Core

10-09 (77.8 m) 0.98% Cu, 1.56 g/t Au 10-09 (91.6 m) 0.61% Cu, 0.87 g/t Au

slide-36
SLIDE 36

Takom Zone

IP Chargeability Background

slide-37
SLIDE 37

Hole No. Interval (m) % Cu Au g/t 08-87 127.3 0.26 0.40 including 32.8 0.45 1.04 07-77 137.3 0.18 0.14 including 53.3 0.27 0.29 74-03 10.7 0.13 1.30 09-01 329.6 0.24 0.27 including 101.0 0.43 0.58

10-12 148.0 0.26 0.40

including 61.9 0.41 0.82

  • 3 km x 2 km IP chargeability high anomaly
  • Veinlets and disseminations of cpy, py, magnetite ± tourmaline in altered diorite
  • Displays similar Cu:Au ratios to Megabuck Zone
  • Mineralization trending N-NE over 300 m strike and 180 m width following a positive

magnetic feature.

  • To Dec 2011: 46 drillholes – 11, 580 m (incl 4,619 m in 16 holes in 2010).

Takom Zone

slide-38
SLIDE 38

Takom Zone Drilling

Chalcopyrite in diorite. 09-10 (230 m) 0.47% Cu, 0.63 g/t Au 09-01 (126 m) 0.85% Cu, 1.17 g/t Au

slide-39
SLIDE 39

Megabuck East Target Area

  • Defined by geophysical IP chargeability + magnetic

anomalies

  • 2003-2008:

6 holes = 990 m; 2011: 3 holes = 1,143 m

  • WJ03-30: 15.4 m @ 0.90% Cu, 0.04 g/t Au

including: 1.14 m @ 7.2% Cu, 0.34 g/t Au

Megabuck Zone Megabuck East Target Deerhorn Zone

Ground Magnetics background

slide-40
SLIDE 40

Cpy in volc ss Tourmaline breccia ME11-02 (72m) ME11-01 (124m)

slide-41
SLIDE 41

Spellbound Area

0.34% Cu + 0.28 g/t Au Over 7.7 m

slide-42
SLIDE 42

Hole No. Interval (m) % Cu Au g/t 10-09 8.0 0.16 0.18 10-10 62.8 0.15 0.10 including 7.7 0.34 0.28 and 15.0 0.004 1.01

  • Large (2.6 km N-S) area with Cu-Mo soil geochem anomalies and coincident

weak IP chargeability trends.

  • Chalcopyrite + minor bornite and molybdenite in strongly k-altered Takomkane

quartz monzonite.

  • To Oct 2010: 8 ddh = 2,182 m
  • Encouraging short intercepts in holes 10-04, 09 and 10. Best results: ~1.5 km N
  • f Southeast Zone.
  • Additional IP and ground mag completed.

Spellbound Area

slide-43
SLIDE 43

Corner Lake Area

slide-44
SLIDE 44
  • 3 km x 2 km IP chargeability anomaly, adjoining to north of Deerhorn

Zone.

  • Pyrite, chalcopyrite + trace bornite as disseminations and quartz stringers

associated with epidote-chlorite-tourmaline alteration in Nicola Gp felsic fragmental rocks and subvolcanic intrusives.

  • 5 ddh = 1,365.5 m

Corner Lake Area

slide-45
SLIDE 45

Tisdall Lake

slide-46
SLIDE 46

TL11-03 (85-91) m

slide-47
SLIDE 47

Woodjam (North + South)

Summary 2011

A) “North” (July 29, 2009 Agreement) - 2011 Expenditures ~ $1M

  • Drilling:
  • Deerhorn Zone -

11 holes = 2,867 m

  • Megabuck Zone -

4 holes = 1,208 m

  • Megabuck East Zone - 3 holes = 1,143 m
  • Tisdall Lake Prospect -

3 holes = 761 m

  • TOTAL

21 holes = 5,979 m

  • Gold Fields expected to vest its initial 51% interest by Q1 2012

B) ”South” (May 20, 2010 Agreement) – 2011 Expenditures ~ $5M

  • Drilling:
  • Southeast Zone -

42 holes = 17,195 m

  • Other targets -

15 holes = 2,900 m

  • TOTAL

57 holes = 20,100 m

  • Gold Fields to provide CWC with NI43-101 compliant resource by Feb 2012
  • Gold Fields to vest into its 51% interest by Q2 2012

Grand Totals (North + South) Drilling = 26,100 m in 78 holes Expenditures = $6M

slide-48
SLIDE 48

WOODJAM Cu-Au-Mo Projects, BC

(Consolidated Woodjam Copper Corporation - Optioned to Gold Fields)

  • Year-round, multi-million dollar exploration programs ($6M in 2011).
  • Rapidly developing into an important Cu-Au-Mo component in the

Quesnel Terrane of British Columbia.

  • Building ounces of Au and pounds of Cu + Mo.

(NI43-101 compliant Inferred Resource for Southeast Zone – Feb 2012).

  • Gold Fields – geological models pluse in-house resources for Megabuck and

Deerhorn Zones.

  • Strategic partnership with Gold Fields.

(expected to earn in 51% in BOTH “North” and “South” projects by early 2012).