
SLIDE 1
Detection of Ultra-high energy neutrinos
The ‘First Light’
- f the high energy neutrino astronomy
Detection of Ultra-high energy neutrinos The First Light of the - - PowerPoint PPT Presentation
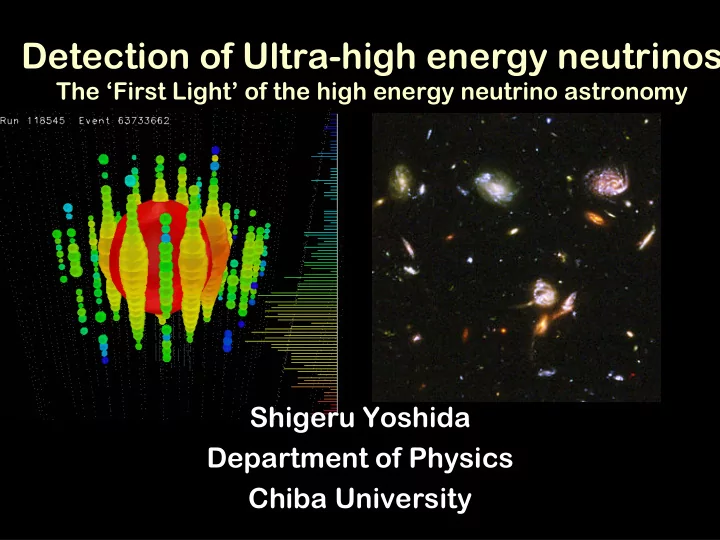
Detection of Ultra-high energy neutrinos The First Light of the high energy neutrino astronomy Shigeru Yoshida Department of Physics Chiba University the 1 st discovery of the PeV Physical Review Letters 111 111, 021103 (2013)
1.04 PeV 1.14 PeV
Physical Review Letters 111 111, 021103 (2013)
The version submitted The version accepted
Arrival directions of UHE cosmic-rays measured by Auger and the Integral X-ray map (above) or the nearby clusters (arxiv-1101.0273 D.Fargion et al)
1. Our hypotheses on the high energy cosmic ray emitters are totally wrong
We may not be so smart.
2. Cannot handle pointing them back to their radiation points
Magnetic field?
Particle charge?
Proton or even iron?
Two possibilities
A super high statistics may resolve B, charge, and source locations, all of which are uncertain at the moment
No electric charge. Coming to us straight Highly complementary – ν can travel over a LONG distance The cons : measurement of ν’s is really a tough business
They are weakly interacting particles a huge detector The atmospheric ν
backgrounds dominates needs excellent filtering programs
Main topic in this talk
The main energy range: Eν ~ 10 8 -10 GeV
cosm ogenic (GZK) neutrinos induced by the interactions of cosmic-ray and CMBs
π+ μ+ νμ e+ νμ νe p >100EeV π0
K
7 . 2
+ + +
Off-Source (<50Mpc) astrophysical neutrino production via GZK (Greisen-Zatsepin-Kuzmin) mechanism
Takami et al Astropart.Phys. 31, 201 (2009) Ahlers et al, Astropart.Phys. 34 106 (2010)
Probe transition from galactic to extra-galactic “Dip” model “Ankle” model Probe maximal radiated energy The region of the main GZK ν intensity
Trace the UHECR emission history
Hopkins and Beacom, Astrophys. J. 651 142 (2006) Redshift (z)
Present Past
color : emission rate of ultra-high energy particles
rare frequent
Intensity gets higher if the emission is more active in the past because ν beams are penetrating over cosmological distances
Many indications that the past was more active. Star formation rate
The spectral emission rate
The cosmological evolution
m= 0 : No evolution
Yoshida and Ishihara, PRD 85 85, 063002 (2012)
ρ ~ (1+z)m 0<z<zmax
Decerprit and Allard, A&A (2012)
GZK cosmogenic
atmospheric
solar ν SN relic
ν
2004: Project Start 1 string 2011: Project completion 86 strings
Digital Optical Module (DOM)
Configuration chronology 2006: IC9 2007: IC22 2008: IC40 2009: IC59 2010: IC79 2011: IC86
PMT
Full operation with all strings since May 2011
Down-going track
μ
from νμ
τ
from ντ @ >> PeV
Up-going track
Cascade (Shower)
directly induced by ν inside the detector volume
, νμ ,ντ all 3 flavor sensitive
9 strings (2006) 22 strings (2007) 40 strings (2008) 59 strings (2009) 79 strings (2010) 86 strings (2011)
2010-2011 - 79 strings May/31/2010-May/12/2011 Effective livetime 319.18days 2011-2012 – 86 strings May/13/2011-May14/2012 Effective livetime 350.91 days
“IC79” “IC86”
published PRD 83 092003 (2011)
selects “up-going” tracks ~40 Hz
selects
“cascade”-like events
~34 Hz
selects “bright” events ~1 Hz
NPE > 1000 p.e. Many others Min Bias Moon IceTop etc
86 strings ~ the completed IceCube
“2nd level” trigger
Secondary μ and τ from ν
Sensitive to νμ
Directly induced events from ν
Sensitive to νe νμ
through-going track starting track/ cascade
Energy Dist. @ IceCube Depth Zenith Dist. @ IceCube Depth
And tracks arrive horizontally
Yoshida et al PRD 69 103004 (2004)
cos(Zenith) “Energy”
down-going up-going
1 atmospheric μ (bundle) atmospheric ν Signal Domain
The blind analysis scheme
Use 10% of the data (test-sample) with masking the rest
with MC simulation
The final-level selection criteria in the plain of NPE-cos(zenith)
IC79 IC86
Number of events (z-axis) per the test-sample livetime test-sample data atmospheric
μ
atmospheric
ν
signal GZK ν
conventional only
ensured the simulations reasonably describe the test-sample data at each of the filter levels
EHE filter level Analysis level Final level
NPE>1000 hit cleanings recalculation of NPEs NPE>3,200 NDOM>300 zenith angle reconstruction > NPEthreshold(cos(zenith))
NPE cos(Zenith)
Experimental data Background MC Signal MC
IC79(285.8days) + IC86 (330.1 days) atmospheric μ bundle atmospheric ν GZK ν
1.00 x 10⁸ 1.33 x 10⁸
4.49
1.04 x 10⁶
3.26
Yoshida & Teshima (1993)
2.11 x 10⁶
2
0.050 1.92
+56.7%
+13.6%
0.082 +49.3%
+68.7% conventional only plus the atmospheric prompt ν
Note: assuming the pure Fe UHECR yielding the higher rate – See the following slides
Total background (IC79+IC86)
Atmospheric μ
Atmospheric ν (Conventional)
Coincidence μ
prompt ν
with prompt
(0.0823)
excluding the test- sample livetime atmospheric prompt neutrino atmospheric conventional neutrino atmospheric muon
Detector efficiency Ice properties/Detector response Cosmic-ray flux variation Cosmic-ray composition Hadronic interaction model
ν
yield from cosmic-ray nucleon
+43.1%
+18.7%
+8.1% +2.2%
remarks
absolute PMT/DOM calibration in-situ calibration by laser
prompt ν model
+12.6%
UHECRs : HiRes – Auger Uncertainties on The Knee spectrum The baseline to calculate atm μ: 100% Fe Compared against the pure proton case The baseline : Sibyll 2.1 Compared to QGSJET –II - 03 The Enberg model perturbative-QCD The Elbert model
Area x ν flux x 4π x livetime = event rate
IC79+IC86 livetime 615.9 days
e
larger below 10 PeV
μ τdominant above 100 PeV
due to effective energy deposition by showers due to the secondary produced
μ
and τ tracks
τ’s
are no longer short-lived particles in EeV
2 events / 615.9 days (excluding the test-sample livetime)
Run119316-Event36556705 Jan 3rd 2012 (“Ernie”) NPE 9.628x10 4 Number of Optical Sensors 312 Run118545-Event63733662 August 9th 2011 (“Bert”) NPE 6.9928x10 4 Number of Optical Sensors 354
p-value 9.0x10⁻⁴ (3.1σ) Super-nicely contained cascades! p-value 2.9x10⁻³ (2.8σ)
The Expected Backgrounds 0.082 0.050
conventional only including prompt +0.041
+0.028
27
The Jan 2012 event - Ernie The Aug 2011 event - Bert
Estimated Energy Deposit +- 15% accuracy
A PeV shower
zenith 11deg zenith 70deg
p + CMBν
p + IR/UV ν
The “Standard” GZK scenarios The “low Energy enhanced” GZK scenarios
type transition of UHECRs from galactic to extragalactic
. Kotera et al JC et al JCAP (2010) (2010)
in streaming ν
(=109 GeV) is the key energy region
The energies of Bert & Ernie is consistent with the expectations from the GZK scenario? Use the Kolmogorov-Smirnov statistics
Ernie Bert Ernie Ernie Bert Bert
KS Erine Bert
Energy PDF of Bert Energy PDF of Ernie KS statistical significance
The standard GZK The low energy GZK p-value 7.5x10⁻² p-value 3.9x10⁻²
assuming the GZK ν spectrum to derive the PDF
(not 99% CL)
Theme #1
e+μ+τ
we would have detected events with greater energies, otherwise
Needs more data/follow-up analyses for further interpretation
all flavor sum
Bert & Ernie
2.8 σ excess over atmospheric
The model-independent upper limit on flux in UHE
null observation in this regime
nearly exclude
allowed by the Fermi γ
Bert & Ernie look for only events with their interaction vertices within the fiducial volume
Area x ν flux x 4π x livetime = event rate
IC79+IC86 livetime 670.1 days
Bert & Ernie Bert & Ernie
Bert & Ernie
+
Bert & Ernie
The hottest spot (p-value 8% - NOT statistically significant)
all flavor sum
Bert & Ernie + O(10) sub-PeV events
4.1 σ excess over atmospheric
The model-independent upper limit on flux in UHE
null observation in this regime
nearly exclude
allowed by the Fermi γ
Hopkins and Beacom, Astrophys. J. 651 142 (2006) Redshift (z)
Present Past
color : emission rate of ultra-high energy particles
rare frequent
Intensity gets higher if the emission is more active in the past because ν beams are penetrating over cosmological distances
Many indications that the past was more active. Star formation rate
The spectral emission rate
The cosmological evolution
m= 0 : No evolution
Effective νe+μ+τ detection exposure 6x10⁷ m2 days sr @ 1EeV = 0.2 km2 sr year ( 6 x Auger ντ exposure) Note: φCR (>1EeV) ~ 20/km2 sr year ν with CR comparable flux should have been detected
νe+μ+τ any model adjacent to the limit is disfavored by the observation
Model GZK Y&T
m=4,zmax=4
GZK Sigl
m=5, zmax=3
GZK Ahler
Fermi Best
GZK Ahler
Fermi Max
GZK Kotera
FR-II
GZK Kotera
SFR/GRB
Topdown GUT
Rate
>100PeV
2.0 3.1 1.5 3.1 2.9 0.5 3.9
Model Rejection Factor
1.13 0.74 1.50 0.72 0.79 4.95 0.59
p-value
1.4x10⁻¹ 4.6x10⁻² 2.2x10⁻¹ 4.4x10⁻² 5.2x10⁻² 6.7x10⁻¹ 2.1x10⁻²
Excluded Mildly Excluded Consistent Maximal ν flux allowed by the Fermi γ-ray measurement
comparison to the nearly ~0 events in the present data
“quiet” “dynamic”
particle emissions in far-universe
intensity above 1 EeV(=1018 eV)
Yoshida and Ishihara, PRD 85 85, 063002 (2012)
Yoshida and Ishihara, PRD 85 85, 063002 (2012)
ρ ~ (1+z)m 0<z<zmax
GZK(-CMB) ν flux Evolution of UHECR sources x IceCube Exposure Number of events we should have detected Identify classes of astronomical objects responsible for UHECRs
46
has already been disfavored
evolved stronger than SFR will soon be ruled out by IceCube if we see no events in EeV rage.
ρ ~ (1+z)m 0<z<zmax
90% C.L. = 3.3 evens above 100PeV 68% C.L. = 1.9 evens above 100PeV
radio laud AGN star formation rate GRB Note: Not precisely known gives the best fit with UHECR spectrum
emission rate per co-moving volume
intensity
Bert & Ernie
Bert & Ernie