
SLIDE 1
1
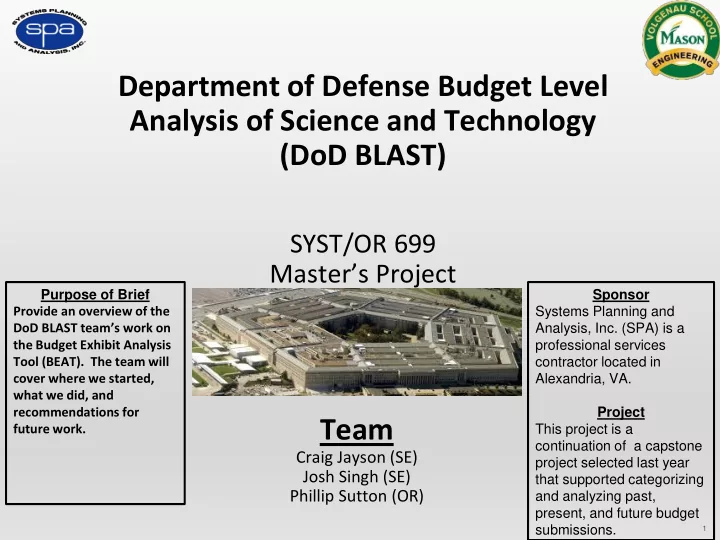
Department of Defense Budget Level Analysis of Science and Technology (DoD BLAST)
SYST/OR 699 Master’s Project
Team
Craig Jayson (SE) Josh Singh (SE) Phillip Sutton (OR)
Sponsor Systems Planning and Analysis, Inc. (SPA) is a professional services contractor located in Alexandria, VA. Project This project is a continuation of a capstone project selected last year that supported categorizing and analyzing past, present, and future budget submissions. Purpose of Brief Provide an overview of the DoD BLAST team’s work on the Budget Exhibit Analysis Tool (BEAT). The team will cover where we started, what we did, and recommendations for future work.