Dedication: Dr. Bill Peterson (1942 2017) 2018 California Current - - PowerPoint PPT Presentation

dedication dr bill peterson 1942 2017 2018 california
SMART_READER_LITE
LIVE PREVIEW

Dedication: Dr. Bill Peterson (1942 2017) 2018 California Current - - PowerPoint PPT Presentation

Agenda Item F.1.a Supplemental CCIEA Team Presentation 1 March 2018 Dedication: Dr. Bill Peterson (1942 2017) 2018 California Current Ecosystem Status Report NOAA California Current IEA Team Presented to the Pacific Fishery Management


slide-1
SLIDE 1

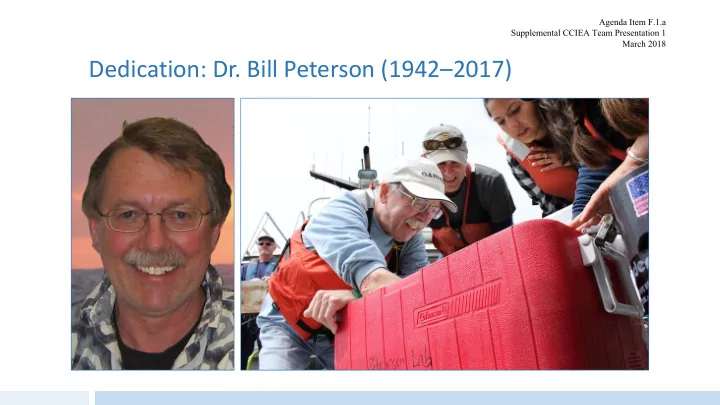
Dedication: Dr. Bill Peterson (1942–2017)

Agenda Item F.1.a Supplemental CCIEA Team Presentation 1 March 2018

slide-2
SLIDE 2

2018 California Current Ecosystem Status Report

NOAA California Current IEA Team

Presented to the Pacific Fishery Management Council March 9, 2018, Rohnert Park, CA

slide-3
SLIDE 3

Summary

  • Climate drivers continued transition from the major warm events
  • In 2017, PDO was neutral; ONI ranged from neutral to weak La Niña
  • Snowpack and stream flows were normal
  • Return to average conditions follows the climate “stress test” in 2014-2016 (Warm Blob,

major El Niño)

  • However, some lingering effects of recent warm anomalies
  • Subsurface warm water remained in the northern part of the system
  • Upwelling was below average in the north, above average central and south
  • Strong hypoxic event in Aug-Sept on the shelf in the northern region

3 2018 California Current Ecosystem Status Report | NOAA California Current IEA Team

slide-4
SLIDE 4

Summary

  • Some ecological indicators finally shifting to more “average” values
  • Copepod community composition off Newport
  • Sea lion pup growth on San Miguel Island
  • No productivity-related mass mortality of seabirds
  • Some upticks in key forage species in central, southern regions
  • Not all ecological and social indicators were encouraging, though
  • Extreme numbers of pyrosomes (warm-water pelagic tunicates)
  • Poor catches of juvenile salmon off WA & OR; poor returns expected to Columbia in 2018
  • Whale entanglement reports in fixed gear remained a significant concern
  • Commercial landings and revenues continued decline through 2016

4 2018 California Current Ecosystem Status Report | NOAA California Current IEA Team

slide-5
SLIDE 5

Summary

  • Emerging patterns from new analyses
  • Spatial indicator of bottom contact by trawl fleet shows areas of highest, lowest activity
  • “Threshold” relationships between indicators of some pressures and species
  • “Early Warning Index” analysis shows no evidence of ecosystem reorganization
  • Dynamic bycatch management may increase swordfish fishing opportunities

5 2018 California Current Ecosystem Status Report | NOAA California Current IEA Team

slide-6
SLIDE 6
  • 1. Physical Conditions

Roughly average, with important exceptions

slide-7
SLIDE 7

Basin-scale climate indices returning to averages

Oceanic Niño Index (ONI)

Positive ONI = El Niño conditions Negative ONI = La Niña conditions

7 2018 California Current Ecosystem Status Report | NOAA California Current IEA Team

Monthly ONI through November, 2017

  • Strongly positive (El Niño)

in 2015-2016

  • Returned to neutral in

late 2016 and remained neutral or negative (weak La Niña) in 2017

  • La Niña is forecast

through June 2018

El Niño La Niña

slide-8
SLIDE 8

Basin-scale climate indices returning to averages

Pacific Decadal Oscillation (PDO)

Positive PDO = warm, lower productivity Negative PDO = cool, greater productivity

8 2018 California Current Ecosystem Status Report | NOAA California Current IEA Team

  • Strongly positive from

2014-2016

  • Returned to neutral in

July 2016

  • Was neutral in nearly all
  • f 2017

Negative PDO Positive PDO

Monthly PDO through December, 2017

slide-9
SLIDE 9

Basin-scale climate indices returning to averages

North Pacific Gyre Oscillation (NPGO)

Positive NPGO = stronger circulation, higher productivity Negative NPGO = weaker circulation, lower productivity

9 2018 California Current Ecosystem Status Report | NOAA California Current IEA Team

  • Strongly negative in 2015
  • Mostly neutral since

2016

  • Was neutral to negative

in nearly all of 2017

Monthly NPGO through October, 2017

slide-10
SLIDE 10

Basin-scale climate indices returning to averages

Sea surface temperature anomalies (SSTa)

10 2018 California Current Ecosystem Status Report | NOAA California Current IEA Team

  • Over last 5 years, SSTa

have been well above average (insets)

  • In 2017, winter SSTa

just slightly above average along coast

  • Summer SSTa mostly

above normal, though not as much as recent years

  • No Blob is forecast

for 2018

Winter (Jan-Mar 2017) Summer (Jul-Sept 2017)

slide-11
SLIDE 11

But, residual subsurface warming persists in north

Temperature anomalies at depth

11 2018 California Current Ecosystem Status Report | NOAA California Current IEA Team

  • 2014-2016: very

warm at surface (Blob)

  • 2016: very warm at

depth (El Niño)

  • In 2017, warmer

than-average water remained at depth

  • ff Newport, OR
slide-12
SLIDE 12

North also experienced relatively weak upwelling

12 2018 California Current Ecosystem Status Report | NOAA California Current IEA Team

  • North: 2017 trend (red line) was better

than 2016 (blue), but still below average (black)

  • Central: 2017 below average until June

and late spring transition, but strong from June-Oct

  • South: 2017 average or above average all

year

slide-13
SLIDE 13

However, north experienced major upwelling-related hypoxia

13 2018 California Current Ecosystem Status Report | NOAA California Current IEA Team

  • Values off Newport and across shelf well below hypoxia

threshold for much of July-Sept

  • Observations of invertebrate kills, displacement of groundfish
  • Likely cause: upwelling of water with unusually low DO

Benthic DO maps from NWFSC groundfish trawl survey, courtesy of Peter Frey, NWFSC

>3 2.5 – 3 2 – 2.5 1.5 – 2 1 – 1.5 0.5 – 1 <0.5

slide-14
SLIDE 14

Snowpack in 2017: near average for 2nd winter in a row

14 2018 California Current Ecosystem Status Report | NOAA California Current IEA Team

  • As a result, stream flows

were also close to long- term averages across all ecoregions in 2017

slide-15
SLIDE 15

Snowpack in 2018: looks okay in north, poor in central & south

15 2018 California Current Ecosystem Status Report | NOAA California Current IEA Team

  • Data updated through March 1st, 2018
  • Most of CA, OR, Southern ID are well below normal
  • Official 2018 measure will be made on April 1st

(approximate date of maximum snowpack)

  • Much can change between now and then; heavy snow in the

northern CCE in late winter of 2017 is a good example of this

  • However, National Weather Service has forecast

drought in 2018 for most of CA and interior OR

slide-16
SLIDE 16

Trends in stream flow for Chinook salmon ESUs

16 2018 California Current Ecosystem Status Report | NOAA California Current IEA Team

  • Only a few Chinook ESUs experiencing significant flow anomalies in last five years
  • Klamath-Trinity (max flow trend), Snake River Fall (min flow trend, avg)
  • Patterns across all ESUs? (increasing max flows, below avg min flows)

Klamath- Trinity Snake R Fall

slide-17
SLIDE 17
  • 2. Ecological responses

Some improvements in productivity, but not in the north

slide-18
SLIDE 18

Copepods off Newport: still lagging

18 2018 California Current Ecosystem Status Report | NOAA California Current IEA Team

  • Energy-rich northern

copepods had very low biomasses, 2014-2016

  • By fall 2017, signs of a

more “average” community, though not an unambiguous shift to a productive state

  • Consistent with

persistent warm water at depth in north

≈ ≈

slide-19
SLIDE 19

Juvenile salmon catches off WA, OR very low in 2017

19 2018 California Current Ecosystem Status Report | NOAA California Current IEA Team

  • Surface trawls from 9

transect lines (NOAA, OSU) target salmon in first year at sea

  • Indicator of early ocean

survival

  • 2017: catches among

the lowest observed in 20 years

slide-20
SLIDE 20

“Stoplight” for 2018 in Columbia R.: below average returns

20 2018 California Current Ecosystem Status Report | NOAA California Current IEA Team

  • Indicators of growing

conditions for last 4 smolt years in northern CCE

  • Color = rank of all years
  • Green: top third
  • Yellow: middle third
  • Red: bottom third
  • Most conditions

consistent with below- average returns to Columbia Basin

Scale of indicators 2014 2015 2016 2017 Coho, 2018 Chinook, 2018 Basin-scale PDO (May-Sept) u u u   u ONI (Jan-Jun)  u u   u Local and regional SST anomalies  u u l l u Deep water temp u u  u u  Deep water salinity u u  u  u Copepod biodiversity  u u   u Northern copepod anomaly l u u u u u Biological spring transition  u u u u u Winter ichthyoplankton biomass u l l l l l Winter ichthyoplankton community   u u u u Juvenile Chinook catch (Jun)   u u u u Juvenile coho catch (Jun)    u u  Smolt year Adult return outlook

slide-21
SLIDE 21

Forage: some increases in central, southern CCE

21 2018 California Current Ecosystem Status Report | NOAA California Current IEA Team

  • Northern CCE: relatively poor

catches of most species (not shown)

  • Central: more krill and squid in

2017; juv rockfish high for 5th year

  • South: anchovy increasing, along

with shortbelly rockfish (but squid decreasing; not shown)

  • Sardine: poor catches coast-wide

(not shown)

slide-22
SLIDE 22

Pyrosomes had an outburst

22 2018 California Current Ecosystem Status Report | NOAA California Current IEA Team

Pyrosoma atlanticum: a warm-water species of pelagic tunicate

  • 126.0
  • 125.0
  • 124.0

40 42 44 46 48

1 2 3 3 4 4 4 5 5 5 6 6 6 7 8

WA OR CA

ape Flattery Columbia R. New port Florence Coos Bay Brookings Cape Mendocino

Pyrosoms 2016

  • 126.0
  • 125.0
  • 124.0

40 42 44 46 48

0.5 0.5 1 1 1.5 1.5 1 . 5 2 2 2 . 5 2.5 3 3 3.5

WA OR CA

ape Flattery Columbia R. New port Florence Coos Bay Brookings Cape Mendocino

Pyrosoms 2015

  • 126.0
  • 125.0
  • 124.0

40 42 44 46 48

0.2 0.2 . 4 . 6 0.8 1 1 1.2 1.4 1 . 6 1.8

WA OR CA

ape Flattery Columbia R. New port Florence Coos Bay Brookings Cape Mendocino

Pyrosoms 2014

  • 126.0
  • 125.0
  • 124.0

40 42 44 46 48 WA OR CA

ape Flattery Columbia R. New port Florence Coos Bay Brookings Cape Mendocino

Pyrosoms 2013

  • 126.0
  • 125.0
  • 124.0

40 42 44 46 48 WA OR CA

ape Flattery Columbia R. New port Florence Coos Bay Brookings Cape Mendocino

Pyrosoms 2011

  • Avg pyrosomes per

tow in 2017 = 11,752!

  • Concerns: competitors

for food; foul gear

  • Pyrosomes already

appearing in 2018

2011 2013 2014 2015 2016

0.0 0.0 1.2 9.2 344.9

Mean per tow

slide-23
SLIDE 23

Sea lion pup growth implies better feeding conditions

23 2018 California Current Ecosystem Status Report | NOAA California Current IEA Team

  • San Miguel colony
  • 2016 pup count was low again;

fewer reproductive females?

  • But, pup growth was normal,

suggesting improved foraging conditions for nursing mothers

  • Preliminary data: 2017 pups had

strong winter growth; maternal diet = anchovy, juv rockfish

slide-24
SLIDE 24

Seabird counts also suggest North is lagging in productivity

24 2018 California Current Ecosystem Status Report | NOAA California Current IEA Team

  • Indicators of forage availability
  • Shearwaters and murres: small fish
  • Cassin’s auklets: krill
  • At-sea counts of shearwaters high in

South, murres high in South and Central; both very low in North

  • Cassin’s auklets signal more ambiguous

(noisy in North, low elsewhere)

  • No major die-offs (“wrecks”)

attributable to productivity in 2017

  • Unlike 3 preceding years
  • Domoic acid impacts in SoCal Bight

At-sea densities

Recent trend Recent average

slide-25
SLIDE 25

Whale entanglement reports

25 2018 California Current Ecosystem Status Report | NOAA California Current IEA Team

  • 4th consecutive year: high number
  • f reports of large whales

entangled in fishing gear

  • Most reports from CA, especially

near Monterey Bay

  • Most gear: unidentified
  • ID’d gear mostly Dungeness crab,

but sablefish gear too (2 in 2016, 1 in 2017)

  • Cause? whales pursuing forage

closer to shore x fishing patterns?

slide-26
SLIDE 26

Groundfish

26 2018 California Current Ecosystem Status Report | NOAA California Current IEA Team

  • No assessed stocks “overfished”
  • Though yelloweye, cowcod not rebuilt
  • 3 rockfish above “overfishing” proxy
  • Black (CA), Black (WA), China (CA)
  • After tweaks to 2015 assessments
  • Notable: substantial increase in

biomass of arrowtooth flounder (important predator?) Will we soon see recruitment of all of the YOY we’ve had in the forage surveys?

slide-27
SLIDE 27

HMS are now in report

27 2018 California Current Ecosystem Status Report | NOAA California Current IEA Team

  • Biomass of eastern swordfish,

skipjack is above avg; bigeye tuna biomass is below avg

  • Recruitment of albacore,

yellowfin, skipjack above avg; bluefin is below avg

  • This is our first attempt to include

HMS indicators; simply drawn from recent assessments

  • We are working on HMS

distribution models, hope to include outputs in future reports

slide-28
SLIDE 28

An “early warning signal” of major ecosystem shifts?

28 2018 California Current Ecosystem Status Report | NOAA California Current IEA Team

  • Are there general indices of system state?
  • Can we use them to anticipate pending shifts in

biological regimes?

  • Example: shifts in ecosystem that have delayed

recovery of Atlantic cod

  • So far, no evidence of system reorganization

after strongly anomalous years

  • Example at left: analysis of underlying “signals” in

data for 32 species of ichthyoplankton in CalCOFI

  • Red dots = major annual shifts; “rare events”
  • The shift did not persist; quickly reverted to central

tendency

slide-29
SLIDE 29
  • 3. Human activities and wellbeing
slide-30
SLIDE 30

Landings through 2016

30 2018 California Current Ecosystem Status Report | NOAA California Current IEA Team

  • Landings data updated

through 2016

  • Landings & revenues on the

whole were down in 2016, driven by CPS, shrimp

  • Buffered a bit by large hake

landings, stable crab landings

Pacific hake coastwide

slide-31
SLIDE 31

Bottom contact gear: coastwide trend is down

31 2018 California Current Ecosystem Status Report | NOAA California Current IEA Team

  • Data from 2002-2015, both trawl and

fixed gear (data availability are variable for fixed gear vessels)

  • Long-term decline in aggregate

contact between gear and seafloor

  • Trend driven by trawling on soft

sediments in north and central regions

slide-32
SLIDE 32

Bottom contact gear: spatial trends provide more context

32 2018 California Current Ecosystem Status Report | NOAA California Current IEA Team

  • Bottom trawl logbook data
  • n start/stop points
  • Left: 2015 relative to mean

from 2002-2015

  • Middle: 5-yr mean
  • Right: 5-yr trend
slide-33
SLIDE 33

Bottom contact gear: spatial trends provide more context

33 2018 California Current Ecosystem Status Report | NOAA California Current IEA Team

  • Bottom trawl logbook data
  • n start/stop points
  • Left: 2015 relative to mean

from 2002-2015

  • Middle: 5-yr mean
  • Right: 5-yr trend
  • North: increases off Southern

Washington, decreases off Cape Blanco

slide-34
SLIDE 34

Bottom contact gear: spatial trends provide more context

34 2018 California Current Ecosystem Status Report | NOAA California Current IEA Team

  • Bottom trawl logbook data
  • n start/stop points
  • Left: 2015 relative to mean

from 2002-2015

  • Middle: 5-yr mean
  • Right: 5-yr trend
  • North: increases off Southern

Washington, decreases off Cape Blanco

  • Central: spottier data, but some

increases north of Mendocino in 2015; below average but increasing in some bands from 2011-2015

slide-35
SLIDE 35

Diversity of vessel “portfolios” still decreasing

35 2018 California Current Ecosystem Status Report | NOAA California Current IEA Team

  • Index of how broadly and

evenly revenue is spread across different fisheries

  • Lowest score is 1; all revenue

from a single fishery

  • Diversification continued

declining across all classifications of West Coast vessels

  • Size, state, total revenue
slide-36
SLIDE 36

Social vulnerability, commercial & recreational reliance

36 2018 California Current Ecosystem Status Report | NOAA California Current IEA Team

  • Social vulnerability vs. per capita “reliance” on fishing-related revenue
  • Some vulnerable communities are highly reliant on both sectors (Westport, Garibaldi, Ilwaco, Moss Landing)
  • There seem to be more vulnerable communities that are commercially reliant than recreationally reliant

Commercial Recreational

slide-37
SLIDE 37
  • 4. Synthesis
slide-38
SLIDE 38

Linking physical processes to management

  • We are exploring how oceanographic

processes are correlated with biology in time and space

  • Goal: to use indicators of drivers to

identify and predict ecosystem processes that are meaningful for management

  • Two examples follow
  • Ecological thresholds
  • Distributions of target and protected species

38 2018 California Current Ecosystem Status Report | NOAA California Current IEA Team

Monthly PDO through December, 2017

slide-39
SLIDE 39

Evidence of ecosystem thresholds

39 2018 California Current Ecosystem Status Report | NOAA California Current IEA Team

  • Northern Oscillation Index:

a basin-scale index related to upwelling in the CCE

  • Using statistical tools,

CCIEA team found threshold NOI value beyond which sea lion pup counts plunge

  • Thresholds could serve as

ecosystem reference points

  • We will explore this further

for salmon and freshwater habitat indicators

slide-40
SLIDE 40

EcoCast estimates of predator distributions related to HMS

40 2018 California Current Ecosystem Status Report | NOAA California Current IEA Team

  • CCIEA team is studying HMS & PR

distributions relative to

  • ceanographic conditions
  • “EcoCast” model may be useful for

anglers—e.g., estimates probability

  • f encountering a protected species

in a particular location

  • May also be useful for management
  • Less of PLCA closed to CDGN fishery
  • Accounts for annual differences in

environmental conditions

% of PLCA that would be closed under DOM

slide-41
SLIDE 41

Conclusions

  • Physical indicators near average levels
  • Ocean conditions lagging in north; poor snowpack possible in central & south
  • Signs that feeding conditions are returning to average
  • Most evident in central and southern waters
  • Not out of the woods yet in north
  • Near-term salmon outlook is discouraging, again
  • Returns, feeding conditions for juveniles, possible drought

Toby.Garfield@noaa.gov, Chris.Harvey@noaa.gov

41 2018 California Current Ecosystem Status Report | NOAA California Current IEA Team

slide-42
SLIDE 42

Extra Slides

42 2018 California Current Ecosystem Status Report | NOAA California Current IEA Team

slide-43
SLIDE 43

Interpreting time series and quad plots

43 2018 California Current Ecosystem Status Report | NOAA California Current IEA Team

Colors and descriptions summarize status and trend for time series in each quadrant Each symbol represents recent status and trend of one time series (normalized to long-term data)

Recent trend Recent average

Time series show data/error relative to long-term mean (- - -) ± 1 standard deviation (—). Symbols at right indicate trend (↗, ↔ or ↘) and mean (+, ● or –) of most recent 5 years (green area) compared to long-term data

slide-44
SLIDE 44

Sampling areas

44 2018 California Current Ecosystem Status Report | NOAA California Current IEA Team

Oceanography Freshwater ecoregions Biological sampling