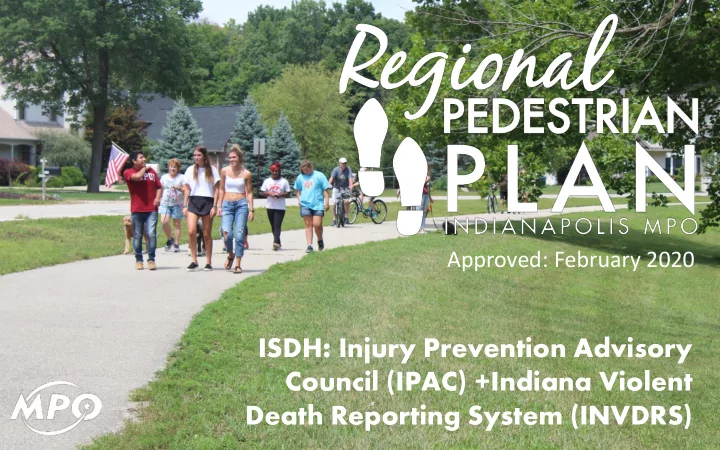

Approved: February 2020 ISDH: Injury Prevention Advisory Council (IPAC) +Indiana Violent Death Reporting System (INVDRS)
Vision & Goals Investment Prioritization Methodology Implementation Recommendations
VISION & GOALS
Provide a safe, efficient, and balanced comprehensive pedestrian network that promotes local and regional connectivity, maximizes community benefit, and establishes pedestrian facilities as an equal component of the regional transportation network. This system should provide for residents’ daily transportation , recreation, and everyday walking uses.
Connectivity: Create a regional network of convenient, connected, and well- designed sidewalks and paths throughout the Central Indiana region. Safety: Create a safe and inviting sidewalks and paths network throughout the MPA. Wellness & Quality of Life: Create sidewalks and paths that promote walking, increase opportunities to walk, and connect people to meaningful destinations. Community Benefit: Recognize and develop projects that provide additional community benefit beyond just the benefits of walking. Collaboration & Education: Communities should work together, across municipal and county boundaries, to support sidewalks and paths that are enjoyable, useful, and have an impact on the most people’s lives.
Plan uses regional priorities to recommend investments May not match local priorities Plan does not propose what communities should do or build • data-driven analysis • resource for local pedestrian planning and implementation • Communities are encouraged to adapt the methodology to their own needs and apply their own priorities to this analytical process
Investment Prioritization Methodology
Rather than proposing projects, identify gaps "Gaps" are missing segments of the pedestrian network Gaps create barriers between neighborhoods, public facilities, and people Gaps identification did not include neighborhood streets or interstates.
Block/Block Group data for Crash Data (ARIES - Automated Reporting • youth, older adults, non-white, poverty households, zero-car Information Exchange System) households, population Lane Widths InfoUSA data for employment Traffic Volumes (AADT) Points for Speed Limits • parks and recreation, healthcare facilities, educational facilities
PRIORITY INVESTMENT AREA INDICES PEDESTRIAN SAFETY Prioritize investment in high-crash or likely risk areas to improve pedestrian safety. Measures of of Pedestria ian Sa Safety: 1. Density of Pedestrian/Vehicular Collisions 2. Existing Pedestrian Infrastructure Network 3. Lane Widths
PRIORITY INVESTMENT AREA INDICES Prioritize investment where people may be more dependent on walking or public transit for the majority of their trips. Measures of of Equity: 1. Densities of Youth 2. Densities of Older Adults 3. Densities of Minority Populations 4. Household Poverty Levels 5. Zero-Car Households
PRIORITY INVESTMENT AREA INDICES WELLNESS Prioritize investment where the pedestrian environment can negatively impact the health of residents. Measures of of Heal alth: 1. Lack of access to Parks and Recreational Opportunities 2. Lack of access to Healthcare Facilities 3. Density of Pedestrian/Vehicular Collisions
PRIORITY INVESTMENT AREA INDICES PEDESTRIAN DEMAND Prioritize investment in areas with higher pedestrian demand (the average volume of pedestrians on the pedestrian network). Measures of of Pedestria ian De Demand: 1. Population Density 2. Employment Density 3. Locations of Educational Facilities
PRIORITY INVESTMENT AREA INDICES WALKING COMFORT Prioritize investment in areas where the level of walking comfort (the level of comfort people feel that the street provides for their mental and physical needs) can be improved. Measures of of Wal alkin ing Com omfort: 1. Traffic Volumes (AADT) 2. Speed Limits 3. Existing Pedestrian Infrastructure Network
Public survey Steering Committee input Regional Transportation Council input
Prioritization results are as follows: • Pedestrian Safety • Equity • Wellness • Pedestrian Demand • Walking Comfort
Process: • 5-tier grid • Cross-referenced with gap network • Non-intersecting gaps were not assigned a tier • Individual county maps
Process: • 5-tier grid • Cross-referenced with gap network • Non-intersecting gaps were not assigned a tier • Individual county maps
Plan uses regional priorities to recommend investments May not match local priorities Plan does not propose what communities should do or build • data-driven analysis • resource for local pedestrian planning and implementation • Communities are encouraged to adapt the methodology to their own needs and apply their own priorities to this analytical process
Limited to data applicable to the entire MPA Incomplete data sets that excluded one or more county were not used to reduce bias • Fixed transit service • Health department data Local streets were left out for scale Communities and organizations with specific boundaries are encouraged to apply data that was left out of the regional analysis
IMPLEMENTATION RECOMMENDATIONS
Examine factors that affect how and where people are walking Examine concerns and challenges related to pedestrian connectivity Examine ways in which pedestrian infrastructure can impact the options and outcomes of walking
Along the Roadway • Multi-Use Paths • Paved Shoulders • Sidewalks • Pedestrian Amenities
Across the Roadway • Accessible Curb Ramps • Automated Pedestrian Detection • Pedestrian Signalization • Crossing Islands • Curb Extensions • Raised Pedestrian Crosswalks • Marked Crosswalks • Pedestrian Overpasses/Underpasses • Advance Stop/Yield Lines • Road Diet • High-Intensity Activated Crosswalk Beacon (HAWK) • Rectangular Rapid Flash Beacon (RRFB)
Complete Streets Policies • Funding Policies • Planning Policies • Design Policies • Maintenance Policies
Support Policies • Parking Policies • Encouragement Policies • Transit Integration Policies • Safety and Enforcement Policies • Education Policies
Full Plan: • tinyurl.com/ulo2a8v Prioritization Maps: • tinyurl.com/u9m64da Approved: February 2020 ISDH: Injury Prevention Advisory Council (IPAC) +Indiana Violent Death Reporting System (INVDRS)
Recommend
More recommend