
SLIDE 1
Mapping the Uncharted Lands of Linked Data
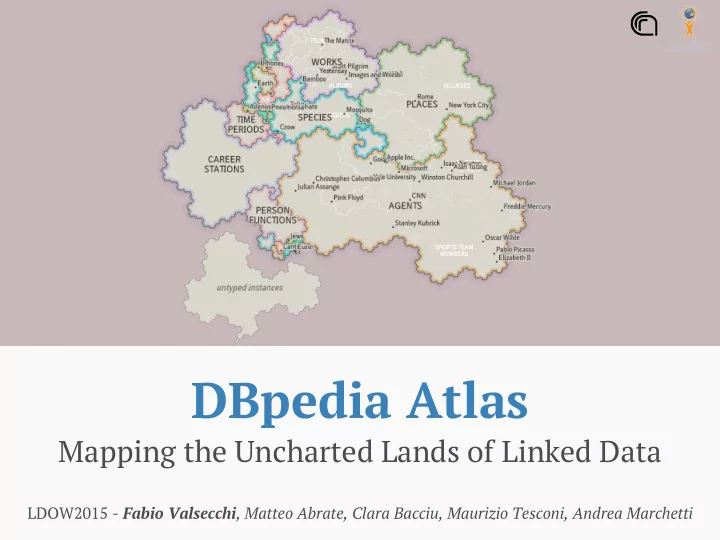
DBpedia Atlas
LDOW2015 - Fabio Valsecchi, Matteo Abrate, Clara Bacciu, Maurizio Tesconi, Andrea Marchetti
DBpedia Atlas Mapping the Uncharted Lands of Linked Data LDOW2015 - - - PowerPoint PPT Presentation
DBpedia Atlas Mapping the Uncharted Lands of Linked Data LDOW2015 - Fabio Valsecchi , Matteo Abrate, Clara Bacciu, Maurizio Tesconi, Andrea Marchetti Motivation Users always ask What is the dataset like? Linked Data sets are
LDOW2015 - Fabio Valsecchi, Matteo Abrate, Clara Bacciu, Maurizio Tesconi, Andrea Marchetti
Lead a user from an overview of the main features of a dataset to its tiniest details.
dataset
*[DBpedia - A crystallization point for the Web of Data]
*[GosperMap: Using a Gosper Curve for Laying Out Hierarchical Data - Auber, D.]
○ Advanced search (SPARQL) ○ Path finding features (à la RelFinder) ○ ...
fabio.valsecchi@wafi.iit.cnr.it