
SLIDE 1
Datacenter application interference
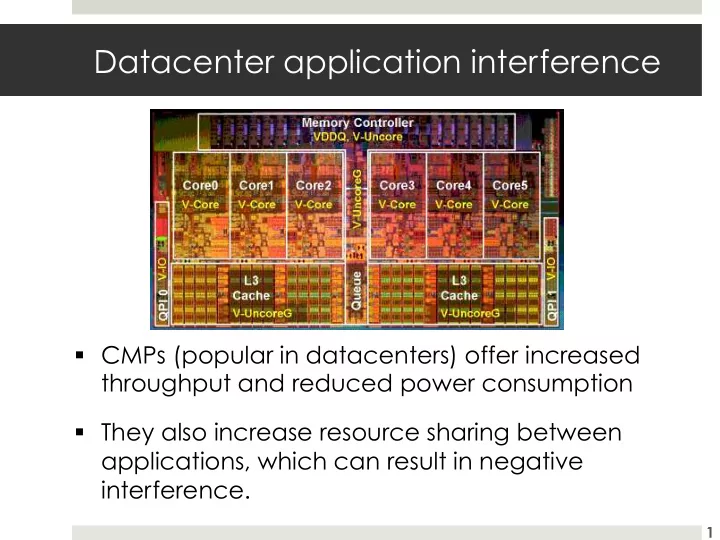
- CMPs (popular in datacenters) offer increased
throughput and reduced power consumption
- They also increase resource sharing between
applications, which can result in negative interference.
1