
SLIDE 1
CPI Climate Finance Project October 2012
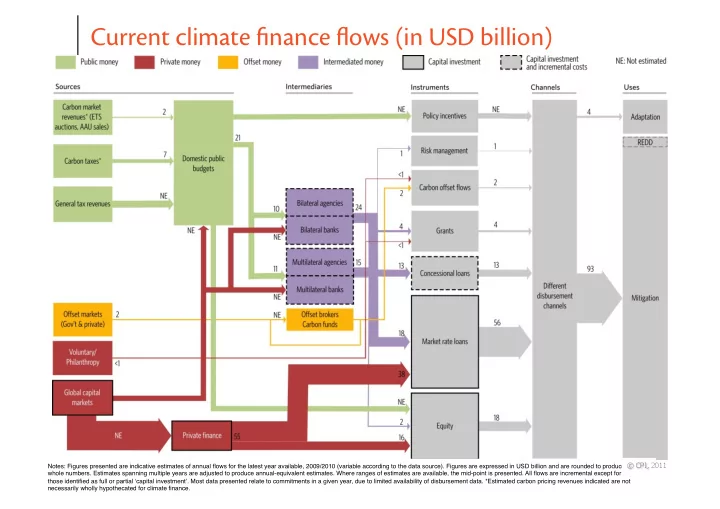
Notes: Figures presented are indicative estimates of annual flows for the latest year available, 2009/2010 (variable according to the data source). Figures are expressed in USD billion and are rounded to produce whole numbers. Estimates spanning multiple years are adjusted to produce annual-equivalent estimates. Where ranges of estimates are available, the mid-point is presented. All flows are incremental except for those identified as full or partial ʻcapital investmentʼ. Most data presented relate to commitments in a given year, due to limited availability of disbursement data. *Estimated carbon pricing revenues indicated are not necessarily wholly hypothecated for climate finance.