SLIDE 1 CAPER 1
OMB Control No: 2506-0117 (exp. 06/30/2018)
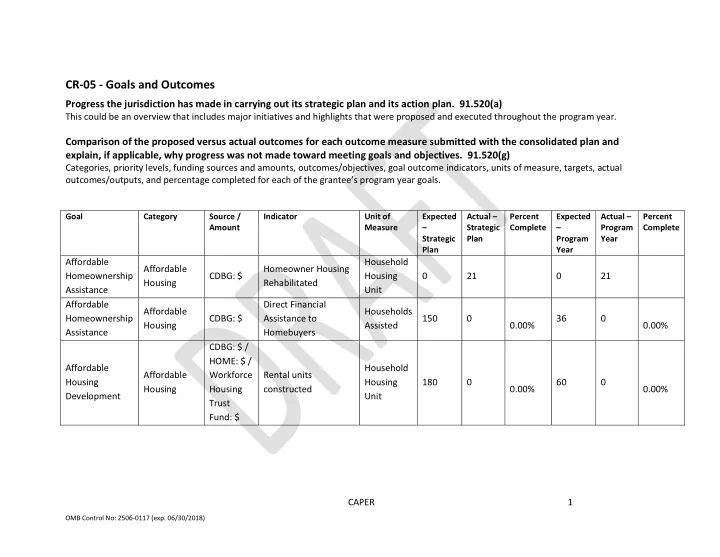
CR-05 - Goals and Outcomes
Progress the jurisdiction has made in carrying out its strategic plan and its action plan. 91.520(a)
This could be an overview that includes major initiatives and highlights that were proposed and executed throughout the program year.
Comparison of the proposed versus actual outcomes for each outcome measure submitted with the consolidated plan and explain, if applicable, why progress was not made toward meeting goals and objectives. 91.520(g)
Categories, priority levels, funding sources and amounts, outcomes/objectives, goal outcome indicators, units of measure, targets, actual
- utcomes/outputs, and percentage completed for each of the grantee’s program year goals.
Goal Category Source / Amount Indicator Unit of Measure Expected – Strategic Plan Actual – Strategic Plan Percent Complete Expected – Program Year Actual – Program Year Percent Complete
Affordable Homeownership Assistance Affordable Housing CDBG: $ Homeowner Housing Rehabilitated Household Housing Unit 21 21 Affordable Homeownership Assistance Affordable Housing CDBG: $ Direct Financial Assistance to Homebuyers Households Assisted 150 0.00% 36 0.00% Affordable Housing Development Affordable Housing CDBG: $ / HOME: $ / Workforce Housing Trust Fund: $ Rental units constructed Household Housing Unit 180 0.00% 60 0.00%
SLIDE 2
CAPER 2
OMB Control No: 2506-0117 (exp. 06/30/2018)
Affordable Housing Development Affordable Housing CDBG: $ / HOME: $ / Workforce Housing Trust Fund: $ Homeowner Housing Added Household Housing Unit 50 0.00% Affordable Housing Development Affordable Housing CDBG: $ / HOME: $ / Workforce Housing Trust Fund: $ Other Other 8 0.00% 4 0.00% Affordable Housing Preservation - Ownership Affordable Housing CDBG: $ Homeowner Housing Rehabilitated Household Housing Unit 1000 0.00% 500 0.00% Affordable Housing Preservation - Rental Affordable Housing CDBG: $ / HOME: $ Rental units rehabilitated Household Housing Unit 250 0.00% 167 0.00% Affordable Housing Preservation - Rental Affordable Housing CDBG: $ / HOME: $ Homeowner Housing Rehabilitated Household Housing Unit 4 4 Affordable Housing Preservation - Rental Affordable Housing CDBG: $ / HOME: $ Other Other 1 0.00%
SLIDE 3 CAPER 3
OMB Control No: 2506-0117 (exp. 06/30/2018)
Economic Opportunity Programs Non-Housing Community Development CDBG: $ Public service activities other than Low/Moderate Income Housing Benefit Persons Assisted 250 0.00% Fair Housing Services (AFH3) Affordable Housing General Fund: $ Public service activities other than Low/Moderate Income Housing Benefit Persons Assisted 3750 0.00% 750 0.00% Fair Housing Services (AFH3) Affordable Housing General Fund: $ Other Other 11 0.00% 3 0.00% Homelessness
Rehousing Affordable Housing CDBG: $ / HOME: $ / ESG: $ / General Fund: $ Public service activities other than Low/Moderate Income Housing Benefit Persons Assisted 3875 1496 38.61% 300 1496 498.67% Homelessness
Rehousing Affordable Housing CDBG: $ / HOME: $ / ESG: $ / General Fund: $ Tenant-based rental assistance / Rapid Rehousing Households Assisted 4600 0.00% 920 0.00% Homelessness
Rehousing Affordable Housing CDBG: $ / HOME: $ / ESG: $ / General Fund: $ Homeless Person Overnight Shelter Persons Assisted 330 16939 330 1.95%
SLIDE 4 CAPER 4
OMB Control No: 2506-0117 (exp. 06/30/2018)
Homelessness
Rehousing Affordable Housing CDBG: $ / HOME: $ / ESG: $ / General Fund: $ Overnight/Emergency Shelter/Transitional Housing Beds added Beds 84695 0.00% Homelessness
Rehousing Affordable Housing CDBG: $ / HOME: $ / ESG: $ / General Fund: $ Homelessness Prevention Persons Assisted 2500 722 28.88% 300 722 240.67% Homelessness
Rehousing Affordable Housing CDBG: $ / HOME: $ / ESG: $ / General Fund: $ Other Other 1 0.00% 1 0.00% Program Administration Non-Housing Community Development CDBG: $ / HOME: $ / ESG: $ Other Other 5 0.00% 1 0.00% Public Facilities and Infrastructure Non-Housing Community Development CDBG: $ Public Facility or Infrastructure Activities other than Low/Moderate Income Housing Benefit Persons Assisted 150000 21965 14.64% 101078 21965 21.73% Services for Children and Youth Non-Housing Community Development CDBG: $ / General Fund: $ Public service activities other than Low/Moderate Income Housing Benefit Persons Assisted 500 21 4.20% 34 21 61.76%
SLIDE 5 CAPER 5
OMB Control No: 2506-0117 (exp. 06/30/2018)
Services for Children and Youth Non-Housing Community Development CDBG: $ / General Fund: $ Homeless Person Overnight Shelter Persons Assisted Services for Senior Citizens Non-Housing Community Development CDBG: $ Public service activities other than Low/Moderate Income Housing Benefit Persons Assisted 8500 1668 19.62% 1500 1668 111.20% Services Low
Special Needs Popul. Non-Housing Community Development CDBG: $ Public service activities other than Low/Moderate Income Housing Benefit Persons Assisted 250 0.00%
Table 1 - Accomplishments – Program Year & Strategic Plan to Date
Assess how the jurisdiction’s use of funds, particularly CDBG, addresses the priorities and specific objectives identified in the plan, giving special attention to the highest priority activities identified.
SLIDE 6
CAPER 6
OMB Control No: 2506-0117 (exp. 06/30/2018)
CR-10 - Racial and Ethnic composition of families assisted
Describe the families assisted (including the racial and ethnic status of families assisted). 91.520(a)
CDBG HOME ESG White 1,343 27 Black or African American 209 3 Asian 40 American Indian or American Native 288 Native Hawaiian or Other Pacific Islander 38 Total 1,918 30 Hispanic 922 11 Not Hispanic 996 19
Table 2 – Table of assistance to racial and ethnic populations by source of funds
Narrative
SLIDE 7 CAPER 7
OMB Control No: 2506-0117 (exp. 06/30/2018)
CR-15 - Resources and Investments 91.520(a)
Identify the resources made available
Source of Funds Source Resources Made Available Amount Expended During Program Year CDBG public - federal 12,981,673 HOME public - federal 7,876,492 ESG public - federal 357,711 General Fund public - local 3,059,862 Other public - local 4,565,154
Table 3 - Resources Made Available
Narrative Identify the geographic distribution and location of investments
Target Area Planned Percentage
Actual Percentage of Allocation Narrative Description Citywide Investment 37 Investment & Reinvestment Areas 9 Investment Areas 33 Reinvestment Areas 21
Table 4 – Identify the geographic distribution and location of investments
Narrative
SLIDE 8 CAPER 8
OMB Control No: 2506-0117 (exp. 06/30/2018)
Leveraging Explain how federal funds leveraged additional resources (private, state and local funds), including a description of how matching requirements were satisfied, as well as how any publicly owned land or property located within the jurisdiction that were used to address the needs identified in the plan.
Fiscal Year Summary – HOME Match
- 1. Excess match from prior Federal fiscal year
- 2. Match contributed during current Federal fiscal year
3 .Total match available for current Federal fiscal year (Line 1 plus Line 2)
- 4. Match liability for current Federal fiscal year
- 5. Excess match carried over to next Federal fiscal year (Line 3 minus Line 4)
Table 5 – Fiscal Year Summary - HOME Match Report
SLIDE 9
CAPER 9
OMB Control No: 2506-0117 (exp. 06/30/2018)
Match Contribution for the Federal Fiscal Year
Project No. or Other ID Date of Contribution Cash (non-Federal sources) Foregone Taxes, Fees, Charges Appraised Land/Real Property Required Infrastructure Site Preparation, Construction Materials, Donated labor Bond Financing Total Match Table 6 – Match Contribution for the Federal Fiscal Year
HOME MBE/WBE report
Program Income – Enter the program amounts for the reporting period Balance on hand at begin- ning of reporting period $ Amount received during reporting period $ Total amount expended during reporting period $ Amount expended for TBRA $ Balance on hand at end of reporting period $
Table 7 – Program Income
SLIDE 10 CAPER 10
OMB Control No: 2506-0117 (exp. 06/30/2018)
Minority Business Enterprises and Women Business Enterprises – Indicate the number and dollar value
- f contracts for HOME projects completed during the reporting period
Total Minority Business Enterprises White Non- Hispanic Alaskan Native or American Indian Asian or Pacific Islander Black Non- Hispanic Hispanic Contracts Number Dollar Amount Sub-Contracts Number Dollar Amount Total Women Business Enterprises Male Contracts Number Dollar Amount Sub-Contracts Number Dollar Amount
Table 8 - Minority Business and Women Business Enterprises
Minority Owners of Rental Property – Indicate the number of HOME assisted rental property owners and the total amount of HOME funds in these rental properties assisted Total Minority Property Owners White Non- Hispanic Alaskan Native or American Indian Asian or Pacific Islander Black Non- Hispanic Hispanic Number Dollar Amount
Table 9 – Minority Owners of Rental Property
SLIDE 11
CAPER 11
OMB Control No: 2506-0117 (exp. 06/30/2018)
Relocation and Real Property Acquisition – Indicate the number of persons displaced, the cost of relocation payments, the number of parcels acquired, and the cost of acquisition Parcels Acquired Businesses Displaced Nonprofit Organizations Displaced Households Temporarily Relocated, not Displaced Households Displaced Total Minority Property Enterprises White Non- Hispanic Alaskan Native or American Indian Asian or Pacific Islander Black Non- Hispanic Hispanic Number Cost
Table 10 – Relocation and Real Property Acquisition
SLIDE 12
CAPER 12
OMB Control No: 2506-0117 (exp. 06/30/2018)
CR-20 - Affordable Housing 91.520(b)
Evaluation of the jurisdiction's progress in providing affordable housing, including the number and types of families served, the number of extremely low-income, low-income, moderate-income, and middle-income persons served.
One-Year Goal Actual Number of Special-Needs households to be provided affordable housing units Total
Table 11 – Number of Households
One-Year Goal Actual Number of households supported through rental assistance Number of households supported through the production of new units Number of households supported through the rehab of existing units Number of households supported through the acquisition of existing units Total
Table 12 – Number of Households Supported
Discuss the difference between goals and outcomes and problems encountered in meeting these goals. Discuss how these outcomes will impact future annual action plans. Include the number of extremely low-income, low-income, and moderate-income persons served by each activity where information on income by family size is required to determine the eligibility of the activity.
Number of Households Served CDBG Actual HOME Actual Extremely Low-income 3 Low-income 10 Moderate-income 6 Total 19
Table 13 – Number of Households Served
SLIDE 13
CAPER 13
OMB Control No: 2506-0117 (exp. 06/30/2018)
Narrative Information
SLIDE 14
CAPER 14
OMB Control No: 2506-0117 (exp. 06/30/2018)
CR-25 - Homeless and Other Special Needs 91.220(d, e); 91.320(d, e); 91.520(c)
Evaluate the jurisdiction’s progress in meeting its specific objectives for reducing and ending homelessness through: Reaching out to homeless persons (especially unsheltered persons) and assessing their individual needs Addressing the emergency shelter and transitional housing needs of homeless persons Helping low-income individuals and families avoid becoming homeless, especially extremely low-income individuals and families and those who are: likely to become homeless after being discharged from publicly funded institutions and systems of care (such as health care facilities, mental health facilities, foster care and other youth facilities, and corrections programs and institutions); and, receiving assistance from public or private agencies that address housing, health, social services, employment, education, or youth needs Helping homeless persons (especially chronically homeless individuals and families, families with children, veterans and their families, and unaccompanied youth) make the transition to permanent housing and independent living, including shortening the period of time that individuals and families experience homelessness, facilitating access for homeless individuals and families to affordable housing units, and preventing individuals and families who were recently homeless from becoming homeless again
SLIDE 15
CAPER 15
OMB Control No: 2506-0117 (exp. 06/30/2018)
CR-30 - Public Housing 91.220(h); 91.320(j)
Actions taken to address the needs of public housing Actions taken to encourage public housing residents to become more involved in management and participate in homeownership Actions taken to provide assistance to troubled PHAs
SLIDE 16 CAPER 16
OMB Control No: 2506-0117 (exp. 06/30/2018)
CR-35 - Other Actions 91.220(j)-(k); 91.320(i)-(j)
Actions taken to remove or ameliorate the negative effects of public policies that serve as barriers to affordable housing such as land use controls, tax policies affecting land, zoning
- rdinances, building codes, fees and charges, growth limitations, and policies affecting the
return on residential investment. 91.220 (j); 91.320 (i) Actions taken to address obstacles to meeting underserved needs. 91.220(k); 91.320(j) Actions taken to reduce lead-based paint hazards. 91.220(k); 91.320(j) Actions taken to reduce the number of poverty-level families. 91.220(k); 91.320(j) Actions taken to develop institutional structure. 91.220(k); 91.320(j) Actions taken to enhance coordination between public and private housing and social service
- agencies. 91.220(k); 91.320(j)
Identify actions taken to overcome the effects of any impediments identified in the jurisdictions analysis of impediments to fair housing choice. 91.520(a)
SLIDE 17 CAPER 17
OMB Control No: 2506-0117 (exp. 06/30/2018)
CR-40 - Monitoring 91.220 and 91.230
Describe the standards and procedures used to monitor activities carried out in furtherance
- f the plan and used to ensure long-term compliance with requirements of the programs
involved, including minority business outreach and the comprehensive planning requirements Citizen Participation Plan 91.105(d); 91.115(d) Describe the efforts to provide citizens with reasonable notice and an opportunity to comment on performance reports.
SLIDE 18
CAPER 18
OMB Control No: 2506-0117 (exp. 06/30/2018)
CR-45 - CDBG 91.520(c)
Specify the nature of, and reasons for, any changes in the jurisdiction’s program objectives and indications of how the jurisdiction would change its programs as a result of its experiences. Does this Jurisdiction have any open Brownfields Economic Development Initiative (BEDI) grants? [BEDI grantees] Describe accomplishments and program outcomes during the last year.
SLIDE 19 CAPER 19
OMB Control No: 2506-0117 (exp. 06/30/2018)
CR-50 - HOME 91.520(d)
Include the results of on-site inspections of affordable rental housing assisted under the program to determine compliance with housing codes and other applicable regulations Please list those projects that should have been inspected on-site this program year based upon the schedule in §92.504(d). Indicate which of these were inspected and a summary of issues that were detected during the inspection. For those that were not inspected, please indicate the reason and how you will remedy the situation. Provide an assessment of the jurisdiction's affirmative marketing actions for HOME units. 92.351(b) Refer to IDIS reports to describe the amount and use of program income for projects, including the number of projects and owner and tenant characteristics Describe other actions taken to foster and maintain affordable housing. 91.220(k) (STATES ONLY: Including the coordination of LIHTC with the development of affordable housing). 91.320(j)
CR-60 - ESG 91.520(g) (ESG Recipients only)
ESG Supplement to the CAPER in e-snaps For Paperwork Reduction Act
- 1. Recipient Information—All Recipients Complete
Basic Grant Information Recipient Name ALBUQUERQUE Organizational DUNS Number 615720401 EIN/TIN Number 856000102 Indentify the Field Office ALBUQUERQUE Identify CoC(s) in which the recipient or subrecipient(s) will provide ESG assistance ESG Contact Name Prefix Ms First Name Carol Middle Name M
SLIDE 20 CAPER 20
OMB Control No: 2506-0117 (exp. 06/30/2018)
Last Name Pierce Suffix Title Family and Community Services Director ESG Contact Address Street Address 1 400 MARQUETTE NW ROOM 504 Street Address 2 PO Box 1293 City ALBUQUERQUE State NM ZIP Code 87103- Phone Number 5057682745 Extension Fax Number 5057683204 Email Address cpierce@cabq.gov ESG Secondary Contact Prefix Ms First Name Heidiliza Last Name Shultz Suffix Title ESG Program Contact Phone Number 5057682844 Extension Email Address hlshultz@cabq.gov
- 2. Reporting Period—All Recipients Complete
Program Year Start Date 07/01/2018 Program Year End Date 06/30/2019
- 3a. Subrecipient Form – Complete one form for each subrecipient
Subrecipient or Contractor Name City State Zip Code DUNS Number Is subrecipient a vistim services provider Subrecipient Organization Type ESG Subgrant or Contract Award Amount
SLIDE 21 CAPER 21
OMB Control No: 2506-0117 (exp. 06/30/2018)
CR-65 - Persons Assisted
- 4. Persons Served
- 4a. Complete for Homelessness Prevention Activities
Number of Persons in Households Total Adults Children Don’t Know/Refused/Other Missing Information Total
Table 16 – Household Information for Homeless Prevention Activities
- 4b. Complete for Rapid Re-Housing Activities
Number of Persons in Households Total Adults Children Don’t Know/Refused/Other Missing Information Total
Table 17 – Household Information for Rapid Re-Housing Activities
Number of Persons in Households Total Adults Children Don’t Know/Refused/Other Missing Information Total
Table 18 – Shelter Information
SLIDE 22
CAPER 22
OMB Control No: 2506-0117 (exp. 06/30/2018)
SLIDE 23 CAPER 23
OMB Control No: 2506-0117 (exp. 06/30/2018)
Number of Persons in Households Total Adults Children Don’t Know/Refused/Other Missing Information Total
Table 19 – Household Information for Street Outreach
- 4e. Totals for all Persons Served with ESG
Number of Persons in Households Total Adults Children Don’t Know/Refused/Other Missing Information Total
Table 20 – Household Information for Persons Served with ESG
- 5. Gender—Complete for All Activities
Total Male Female Transgender Don't Know/Refused/Other Missing Information Total
Table 21 – Gender Information
SLIDE 24 CAPER 24
OMB Control No: 2506-0117 (exp. 06/30/2018)
- 6. Age—Complete for All Activities
Total Under 18 18-24 25 and over Don’t Know/Refused/Other Missing Information Total
Table 22 – Age Information
- 7. Special Populations Served—Complete for All Activities
Number of Persons in Households
Subpopulation Total Total Persons Served – Prevention Total Persons Served – RRH Total Persons Served in Emergency Shelters Veterans Victims of Domestic Violence Elderly HIV/AIDS Chronically Homeless Persons with Disabilities: Severely Mentally Ill Chronic Substance Abuse Other Disability Total (unduplicated if possible)
Table 23 – Special Population Served
SLIDE 25 CAPER 25
OMB Control No: 2506-0117 (exp. 06/30/2018)
CR-70 – ESG 91.520(g) - Assistance Provided and Outcomes
Number of New Units – Rehabbed Number of New Units – Conversion Total Number of bed - nigths available Total Number of bed - nights provided Capacity Utilization
Table 24 – Shelter Capacity
- 11. Project Outcomes Data measured under the performance standards developed in
consultation with the CoC(s)
SLIDE 26 CAPER 26
OMB Control No: 2506-0117 (exp. 06/30/2018)
CR-75 – Expenditures
- 11. Expenditures
- 11a. ESG Expenditures for Homelessness Prevention
Dollar Amount of Expenditures in Program Year 2016 2017 2018 Expenditures for Rental Assistance Expenditures for Housing Relocation and Stabilization Services - Financial Assistance Expenditures for Housing Relocation & Stabilization Services - Services Expenditures for Homeless Prevention under Emergency Shelter Grants Program Subtotal Homelessness Prevention
Table 25 – ESG Expenditures for Homelessness Prevention
- 11b. ESG Expenditures for Rapid Re-Housing
Dollar Amount of Expenditures in Program Year 2016 2017 2018 Expenditures for Rental Assistance Expenditures for Housing Relocation and Stabilization Services - Financial Assistance Expenditures for Housing Relocation & Stabilization Services - Services Expenditures for Homeless Assistance under Emergency Shelter Grants Program Subtotal Rapid Re-Housing
Table 26 – ESG Expenditures for Rapid Re-Housing
SLIDE 27 CAPER 27
OMB Control No: 2506-0117 (exp. 06/30/2018)
- 11c. ESG Expenditures for Emergency Shelter
Dollar Amount of Expenditures in Program Year 2016 2017 2018 Essential Services Operations Renovation Major Rehab Conversion Subtotal
Table 27 – ESG Expenditures for Emergency Shelter
- 11d. Other Grant Expenditures
Dollar Amount of Expenditures in Program Year 2016 2017 2018 Street Outreach HMIS Administration
Table 28 - Other Grant Expenditures
- 11e. Total ESG Grant Funds
Total ESG Funds Expended 2016 2017 2018
Table 29 - Total ESG Funds Expended
SLIDE 28 CAPER 28
OMB Control No: 2506-0117 (exp. 06/30/2018)
2016 2017 2018 Other Non-ESG HUD Funds Other Federal Funds State Government Local Government Private Funds Other Fees Program Income Total Match Amount
Table 30 - Other Funds Expended on Eligible ESG Activities
Total Amount of Funds Expended on ESG Activities 2016 2017 2018
Table 31 - Total Amount of Funds Expended on ESG Activities