
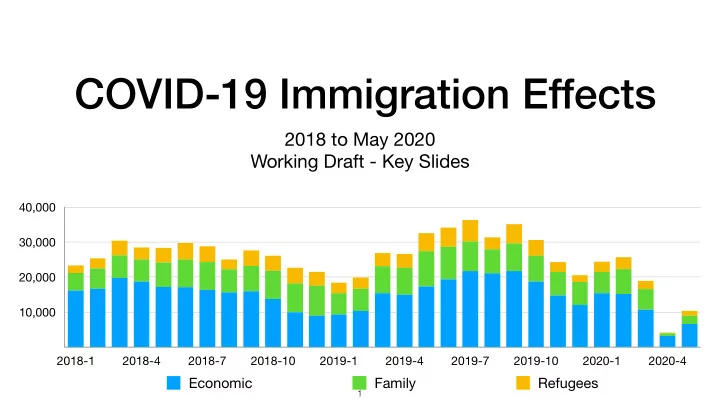
SLIDE 1
COVID-19 Immigration Effects
2018 to May 2020 Working Draft - Key Slides
10,000 20,000 30,000 40,000 2018-1 2018-4 2018-7 2018-10 2019-1 2019-4 2019-7 2019-10 2020-1 2020-4
Economic Family Refugees
1
COVID-19 Immigration Effects 2018 to May 2020 Working Draft - Key - - PowerPoint PPT Presentation
COVID-19 Immigration Effects 2018 to May 2020 Working Draft - Key Slides 40,000 30,000 20,000 10,000 2018-1 2018-4 2018-7 2018-10 2019-1 2019-4 2019-7 2019-10 2020-1 2020-4 Economic Family Refugees 1 Programs Examined
2018 to May 2020 Working Draft - Key Slides
10,000 20,000 30,000 40,000 2018-1 2018-4 2018-7 2018-10 2019-1 2019-4 2019-7 2019-10 2020-1 2020-4
Economic Family Refugees
1
Agreements (e.g., NAFTA, GATS), Canadian Interests (e.g., intra-corporate transfers, work exchange programs, post-graduate employment, spouses)
caregivers, agriculture workers, other workers with Labour Market Impact Assessment (LMIA)
2
Family -76.6%, Refugees -72.0%
Agreements -53.6%, Canadian Interests -43.3%
3
4
10,000 20,000 30,000 40,000 2018-1 2018-4 2018-7 2018-10 2019-1 2019-4 2019-7 2019-10 2020-1 2020-4
Economic Family Refugees
5
25% 50% 75% 100% 2018-1 2018-4 2018-7 2018-10 2019-1 2019-4 2019-7 2019-10 2020-1 2020-4
Asia Africa Americas Europe Oceania
6
2250 4500 6750 9000 2018-1 2018-4 2018-7 2018-10 2019-1 2019-4 2019-7 2019-10 2020-1 2020-4
7
Year to Year Comparison (monthly)
0% 22.5% 45% 2019-1 2019-2 2019-3 2019-4 2019-5 2019-6 2019-7 2019-8 2019-9 2019-10 2019-11 2019-12 2020-1 2020-2 2020-3 2020-4 2020-5
28.1% 32.7%
9.5% 18.3% 27.1% 24.7% 26.1% 14.3% 14.8%
8
Year to year comparison (monthly)
0% 20% 40% 60% 80% 2019-1 2019-2 2019-3 2019-4 2019-5 2019-6 2019-7 2019-8 2019-9 2019-10 2019-11 2019-12 2020-1 2020-2 2020-3 2020-4 2020-5
45.6% 64.7% 13.5% 43.2% 38.4% 36.8% 57.3% 43.2% 25.4%
9
Year to Year Comparison by Category—Last Quarter, May 2020
0% 20% Economic Family Refugees
17.7%
May 2020 1st Quarter
10
Year to Year Comparison by Category—Last Quarter, May 2020
0% 20% 40% 60% Atlantic ON MB SK AB BC 37.2% 42.3% 25.8% 2.9%
7.7%
May 2020 1st Quarter
11
Year to Year Comparison (May 2020, Last Quarter) Top 10 Countries — Ordered by 2018 base year
0% 22.5% 45% 67.5% 90% India Philippines China Syria Nigeria USA Pakistan France Eritrea UK
12.4%
84.1% 5.3% 16.8% 13.8% 7%
7.3%
May 2020 Last Quarter
12
13
10,000 20,000 30,000 40,000 2018-1 2018-4 2018-7 2018-10 2019-1 2019-4 2019-7 2019-10 2020-1 2020-4
Agreements Canadian Interests Caregivers Agriculture LMIA
14
25% 50% 75% 100% 2018-1 2018-4 2018-7 2018-10 2019-1 2019-4 2019-7 2019-10 2020-1 2020-4
Asia Europe Americas Africa Oceania
15
25% 50% 75% 100% 2018-1 2018-4 2018-7 2018-10 2019-1 2019-4 2019-7 2019-10 2020-1 2020-4
Americas Asia Europe Africa Oceania
16
Year to Year Comparison (Monthly)
0% 17.5% 35% 52.5% 70% 2019-1 2019-2 2019-3 2019-4 2019-5 2019-6 2019-7 2019-8 2019-9 2019-10 2019-11 2019-12 2020-1 2020-2 2020-3 2020-4 2020-5
IMP TFWP
17
Year to Year Comparison by Category—Last Quarter, May 2020
0% 20% 40% Agreements Canadian Interests Caregivers Agriculture LMIA 34.6%
1.2%
May 2020 1st Quarter
18
Year to Year Comparison (May 2020, Last Quarter) Top 10 Countries — Ordered by 2018 base year
0% 25% 50% India Philippines China Syria Nigeria USA Pakistan France Eritrea UK
10.7%
24.4%
May 2020 Last Quarter
19
Year to Year Comparison (May 2020, Last Quarter) Top 10 Countries — Ordered by 2018 base year
0% 22.5% 45% 67.5%
Mexico Jamaica Guatemala Philippines India Korea USA UK China France
26% 22%
23.2% 21.2%
12.8%
30.7% 51.1%
May 2020 Last Quarter
20
21
30,000 60,000 90,000 120,000 2018-1 2018-4 2018-7 2018-10 2019-1 2019-4 2019-7 2019-10 2020-1 2020-4
Secondary or less Post Secondary Other Studies
22
25% 50% 75% 100% 2018-1 2018-4 2018-7 2018-10 2019-1 2019-4 2019-7 2019-10 2020-1 2020-4
Asia Americas Africa Europe Oceania
23
Year to Year Comparison by Province—Last Quarter, May 2020
0% 10% 20% 30% 40% Atlantic QC ON MB SK AB BC
24.4% 31.6% 8.0% 40.0% 15.2%
May 2020 1st Quarter
24
Year to Year Comparison by Level ( May 2020/2019) Top 10 Countries — Ordered by Number of Permits
India China Korea France Vietnam Brazil Iran Japan USA Nigeria
0% 45% 90% 135% 180% 75.7% 122.6%
86.2%
171.7% 40.3% 14% 1.6%
Number 6,935 9,130 1,550 540 2,255 570 1,145 350 590 975
25
Year to Year Comparison (May 2020, Last Quarter) Top 10 Countries — Ordered by Number of Permits
0% 45% 90% 135% 180% India China Korea France Vietnam Brazil Iran Japan USA Nigeria
1.2% 75.7% 122.6%
86.2%
171.7% 40.3% 14% 1.6%
May 2020 Last Quarter
26
27
were most affected? Similarly, which programs and source countries recovered more quickly?
country?
tensions with China a factor?
which countries?
28
10 Countries 25 Countries Permanent Residents 60.9% 77.7% IMP 70.8% 86.4% TFWP 85.2% 93.2% Study Permits 70.3% 73.8%
29
Permanent Residents IMP TFWP Students India 69,980 India 55,610 Mexico 28,860 India 107,105 Philippines 35,050 USA 26,540 Jamaica 10,200 China 85,100 China 29,710 Finland 23,445 Guatemala 9,810 Korea 16,875 Syria 12,045 China 21,910 Philippines 8,750 Vietnam 12,370 Nigeria 10,920 UK 11,205 India 7,380 Iran 7,040 USA 10,905 Australia 8,850 Korea 1,960 Japan 6,685 Pakistan 9,490 Ireland 8,675 USA 1,850 Bangladesh 4,155 France 6,175 Korea 8,105 UK 940 Philippines 4,075 Eritrea 5,695 Brazil 8,080 China 935 Taiwan 3,160 UK 5,660 Japan 7,250 France 915 Saudi Arabia 2,870
30