
SLIDE 1
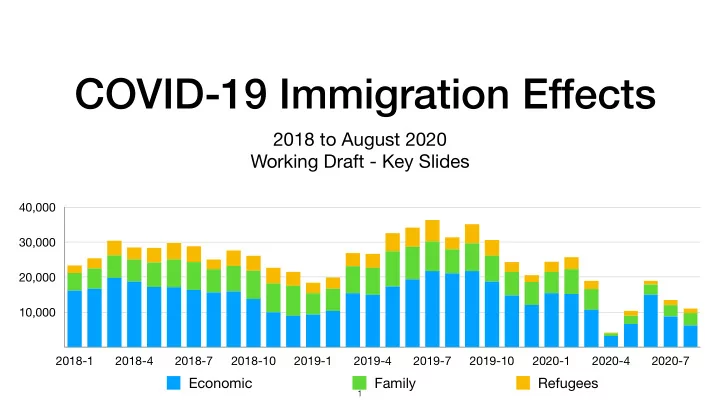
COVID-19 Immigration Effects
2018 to August 2020 Working Draft - Key Slides
10,000 20,000 30,000 40,000 2018-1 2018-4 2018-7 2018-10 2019-1 2019-4 2019-7 2019-10 2020-1 2020-4 2020-7
Economic Family Refugees
1
COVID-19 Immigration Effects 2018 to August 2020 Working Draft - Key - - PowerPoint PPT Presentation
COVID-19 Immigration Effects 2018 to August 2020 Working Draft - Key Slides 40,000 30,000 20,000 10,000 2018-1 2018-4 2018-7 2018-10 2019-1 2019-4 2019-7 2019-10 2020-1 2020-4 2020-7 Economic Family Refugees 1 Programs Examined
2018 to August 2020 Working Draft - Key Slides
10,000 20,000 30,000 40,000 2018-1 2018-4 2018-7 2018-10 2019-1 2019-4 2019-7 2019-10 2020-1 2020-4 2020-7
Economic Family Refugees
1
Canadian Interests (e.g., intra-corporate transfers, work exchange programs, post-graduate employment, spouses)
workers with Labour Market Impact Assessment (LMIA)
2
decline: Economic 70.8%, Family 48.6%, Refugees 60%
this year
20,000) NEEDS UPDATE
3
4
15,000 30,000 45,000 60,000 2018-1 2018-4 2018-7 2018-10 2019-1 2019-4 2019-7 2019-10 2020-1 2020-4 2020-7
Asia Africa Americas Europe Oceania
5
10,000 20,000 30,000 40,000 2018-1 2018-4 2018-7 2018-10 2019-1 2019-4 2019-7 2019-10 2020-1 2020-4 2020-7
Economic Family Refugees
6
25% 50% 75% 100% 2018-1 2018-4 2018-7 2018-10 2019-1 2019-4 2019-7 2019-10 2020-1 2020-4 2020-7
Asia Africa Americas Europe Oceania
7
2,250 4,500 6,750 9,000 2018-1 2018-4 2018-7 2018-10 2019-1 2019-4 2019-7 2019-10 2020-1 2020-4 2020-7
8
Year to year comparison (monthly)—2018-20
0% 22.5% 45% 67.5% 90% 2019-1 2019-2 2019-3 2019-4 2019-5 2019-6 2019-7 2019-8 2019-9 2019-10 2019-11 2019-12 2020-1 2020-2 2020-3 2020-4 2020-5 2020-6 2020-7 2020-8
45.6% 64.7% 13.5% 43.2% 38.4% 36.8% 57.3% 43.2% 25.4%
28.1% 32.7%
9.5% 18.3% 27.1% 24.7% 26.1% 14.3% 14.8%
PRs Total PNP
9
Year to Year Comparison by Category—August 2020, Last Quarter
0% Economic Family Refugees
August 2020 April-June
10
Year-over-year Comparison by Category—August 2020, Last Quarter Top 10 Countries — Ordered by 2018 base year
8% Atlantic ON MB SK AB BC
7.7%
August 2020 Last Quarter
11
Year to Year Comparison (August 2020, Last Quarter) Top 10 Countries — Ordered by 2018 base year
0% India Philippines China Syria Nigeria USA Pakistan France Eritrea UK
August 2020 April-June
12
By Program—2018-20
3,500 7,000 10,500 14,000 2018-1 2018-4 2018-7 2018-10 2019-1 2019-4 2019-7 2019-10 2020-1 2020-4 2020-7
IMP Post-Graduate WP Students TFWP
13
Year-over-year Comparison by Province—August 2020, Last Quarter Top 10 Countries — Ordered by 2018 base year
0% Atlantic QC ON MB SK AB BC
August 2020 April-June
14
Year to Year Comparison by Program—August 2020, Last quarter
0% IMP Post-Graduate WP Students TFWP
August 2020 April-June
15
1,750 3,500 5,250 7,000 2018-1 2018-4 2018-7 2018-10 2019-1 2019-4 2019-7 2019-10 2020-1 2020-4 2020-7
Airport Border Inland
16
Comparison by Category—August 2020, Last Quarter
0% Airport Border Inland
August 2020 April-June
17
Top 10 Countries—Ordered by 2018 base year—August 2020, Last Quarter
10% India Mexico Iran Nigeria Colombia Pakistan China Turkey Haiti USA
9.7%
August 2020 April-June
18
19
10,000 20,000 30,000 40,000 2018-1 2018-4 2018-7 2018-10 2019-1 2019-4 2019-7 2019-10 2020-1 2020-4 2020-7
Agreements Canadian Interests Caregivers Agriculture LMIA
20
0% 25% 50% 75% 100% 2018-1 2018-4 2018-7 2018-10 2019-1 2019-4 2019-7 2019-10 2020-1 2020-4 2020-7
Asia Europe Americas Africa Oceania
21
0% 25% 50% 75% 100% 2018-1 2018-4 2018-7 2018-10 2019-1 2019-4 2019-7 2019-10 2020-1 2020-4 2020-7
Americas Asia Europe Africa Oceania
22
Year to Year Comparison (Monthly)
0% 17.5% 35% 52.5% 70% 2019-1 2019-2 2019-3 2019-4 2019-5 2019-6 2019-7 2019-8 2019-9 2019-10 2019-11 2019-12 2020-1 2020-2 2020-3 2020-4 2020-5 2020-6 2020-7 2020-8
IMP TFWP
23
Year to Year Comparison by Category—August 2020, Last Quarter
0% 20% 40% 60% 80% Agreements Canadian Interests Caregivers Agriculture LMIA
73.8%
August 2020 April-June
24
Year to Year Comparison (August 2020, Last Quarter) Top 10 Countries—Ordered by 2018 base year
0% India USA France China UK Australia Ireland Korea Brazil Japan
August 2020 April-June
25
Year to Year Comparison (August 2020, Last Quarter) Top 10 Countries—Ordered by 2018 base year
0% 35% 70% 105% 140%
Mexico Jamaica Guatemala Philippines India Korea USA UK China France
13.5% 8%
57.8% 96.3% 127.6%
August 2020 April-June
26
40,000 80,000 120,000 160,000 2018-1 2018-4 2018-7 2018-10 2019-1 2019-4 2019-7 2019-10 2020-1 2020-4 2020-7
Canada Asia Americas Europe Oceania Africa Not captured
27
Work Permits—Web Interest Year to Year Comparison (September 2020, Last Quarter)
Top 10 Countries by “Get a work permit” ordered by site visits, 2018 base year
0% 15% India USA Mexico UK Australia Pakistan Brazil Philippines UAE Saudi Arabia
5.7%
Sep 2020 July-Sep
28
29
17,500 35,000 52,500 70,000 2018-1 2018-4 2018-7 2018-10 2019-1 2019-4 2019-7 2019-10 2020-1 2020-4 2020-7
Asia Africa Americas Europe Oceania
30
30,000 60,000 90,000 120,000 2018-1 2018-4 2018-7 2018-10 2019-1 2019-4 2019-7 2019-10 2020-1 2020-4 2020-7
Secondary or less Post Secondary Other Studies
31
0% 25% 50% 75% 100% 2018-1 2018-4 2018-7 2018-10 2019-1 2019-4 2019-7 2019-10 2020-1 2020-4 2020-7
Asia Africa Americas Europe Oceania
32
Year-over-year Comparison (August 2020, Last Quarter) Top 10 Countries — Ordered by Number of Permits, 2018 base year
0% 22.5% 45% India China Korea France Vietnam Brazil Iran Japan USA Nigeria
36.8%
27.5%
August 2020 April-June
33
Year-over-year Comparison by Province—August 2020, Last Quarter
0% Atlantic QC ON MB SK AB BC
August 2020 April-June
34
30,000 60,000 90,000 120,000 2018-1 2018-4 2018-7 2018-10 2019-1 2019-4 2019-7 2019-10 2020-1 2020-4 2020-7
Canada Asia Americas Africa Europe Oceania Not captured
35
Study Permits—Web Interest Year-over-year Comparison (September 2020, Last Quarter)
Top 10 Countries by “Get your study permit” ordered by site visits, 2018 base year
0% 25% 50% 75% India USA China Nigeria Brazil PhilippinesColombia Mexico Iran Pakistan
12.4%
22%
9.7%
33.1% 21.6%
42.9% 22.7% 29.6% 2.3% 6.9%
60% 35.5%
Sep 2020 July-Sep
36
37
62,500 125,000 187,500 250,000 2018-1 2018-4 2018-7 2018-10 2019-1 2019-4 2019-7 2019-10 2020-1 2020-4
Information and Orientation Services Needs Assessment and Referrals Language Training Language Assessment Community Connections Employment Related Services Resettlement Assistance Program
38
Year-over-year Comparison by Province—May 2020, Last Quarter
0% 12.5% Atlantic QC ON MB SK AB BC
2.1%
May 2020 Jan-March
39
Year-over-year Comparison (May 2020, Last Quarter) Top 10 Non-EU Not USA—Ordered by Number of PRs, 2018 base year
0% 17.5% 35% India Philippines China Syria Nigeria Pakistan Eritrea Iran Iraq Korea, South
11.4%
26.6%
6.4%
May 2020 Jan-March
40
10,000 20,000 30,000 40,000 2018-11 2019-2 2019-5 2019-8 2019-11 2020-2 2020-5 2020-8
Canada Asia Americas Europe Africa Oceania Other
41
Settlement Services—Web Interest Year-over-year Comparison (September 2020, Last Quarter)
Top 10 Countries by “Find immigrant services near you” ordered by site visits, 2018 base year
0% 20% India USA Brazil UAE Pakistan Nigeria Mexico UK ColombiaPhilippines
13%
Sep 2020 July-Sep
42
43
7,500 15,000 22,500 30,000 2018-1 2018-4 2018-7 2018-10 2019-1 2019-4 2019-7 2019-10 2020-1 2020-4
Asia Africa Americas Europe Oceania
44
Year-over-year Comparison (June 2020, Last Quarter) Top 10 Countries—Ordered by 2018 base year
Philippines India Iran China Pakistan Nigeria USA Egypt Iraq France
June 2020 April-June
45
Note: Technical anomaly April - December 2019
45,000 90,000 135,000 180,000 2018-1 2018-4 2018-7 2018-10 2019-1 2019-4 2019-7 2019-10 2020-1 2020-4 2020-7
Canada Americas Asia Europe Africa Oceania Not captured
46
Citizenship—Web Interest 2020 to 2018 Comparison (September 2020, Last Quarter)
Top 10 Countries by “Apply for Citizenship” ordered by site visits, 2018 base year
0% 50% 100% 150% 200% USA India UK Pakistan UAE Nigeria China Brazil Turkey Bangladesh
3.1% 12.3% 12.6% 12.5% 111.3% 1%
1.6%
0.4% 6.9% 13.9% 23% 183.9%
Sep 2020 July-Sep
47
48
45,000 90,000 135,000 180,000 2018-1 2018-4 2018-7 2018-10 2019-1 2019-4 2019-7 2019-10 2020-1 2020-4
Asia Americas Africa Europe Oceania Other
49
Year-over-year Comparison (June 2020, Last Quarter) Top 10 Countries—Ordered by 2018 base year
0% 25%
China India Philippines Brazil Colombia Indonesia Pakistan Nigeria Trinidad Jamaica
4.6% 11.5%
9.1%
June 2020 Jan-March
50
51
were most affected? Similarly, which programs and source countries recovered more quickly?
country?
tensions with China a factor?
which countries?
52
10 Countries 25 Countries Permanent Residents 60.9% 77.7% IMP 70.8% 86.4% TFWP 85.2% 93.2% Study Permits 70.3% 73.8% Asylum Claimants 57.4% 77.4% Citizenship 50.3% 71.5%
53
Permanent Residents IMP TFWP Students Citizenship India 69,980 India 55,610 Mexico 28,860 India 107,105 Philippines 19,647 Philippines 35,050 USA 26,540 Jamaica 10,200 China 85,100 India 19,486 China 29,710 Finland 23,445 Guatemala 9,810 Korea 16,875 Iran 10,037 Syria 12,045 China 21,910 Philippines 8,750 Vietnam 12,370 PRC 9,718 Nigeria 10,920 UK 11,205 India 7,380 Iran 7,040 Pakistan 9,406 USA 10,905 Australia 8,850 Korea 1,960 Japan 6,685 Nigeria 4,398 Pakistan 9,490 Ireland 8,675 USA 1,850 Bangladesh 4,155 USA 4,229 France 6,175 Korea 8,105 UK 940 Philippines 4,075 Egypt 4,115 Eritrea 5,695 Brazil 8,080 China 935 Taiwan 3,160 Iraq 3,951 UK 5,660 Japan 7,250 France 915 Saudi Arabia 2,870 France 3,836
54
Immigration Category, Canada – Admissions of Permanent Residents with Prior International Mobility Program Work Permit Holder Status by Province/Territory of Intended Destination and Immigration Category, Canada – Admissions of Permanent Residents with Prior Study Permit Holder Status by Province/Territory of Intended Destination and Immigration Category, Canada – Admissions of Permanent Residents with Prior Temporary Foreign Worker Program Work Permit Holder Status by Province/Territory of Intended Destination and Immigration Category
(2019 ranking), Claim Office Type and Claim Year
permit(s) became effective, Canada - Temporary Foreign Worker Program (TFWP) work permit holders by province/territory of intended destination, program and year in which permit(s) became effective, Canada – International Mobility Program work permit holders by country of citizenship and year in which permit(s) became effective, Canada – Temporary Foreign Worker Program work permit holders by country of citizenship and year in which permit(s) became effective
holders by province/territory of intended destination, study level and year in which permit(s) became effective, Source Countries - Applications Processed by IRCC for New Study Permit Applications
55