
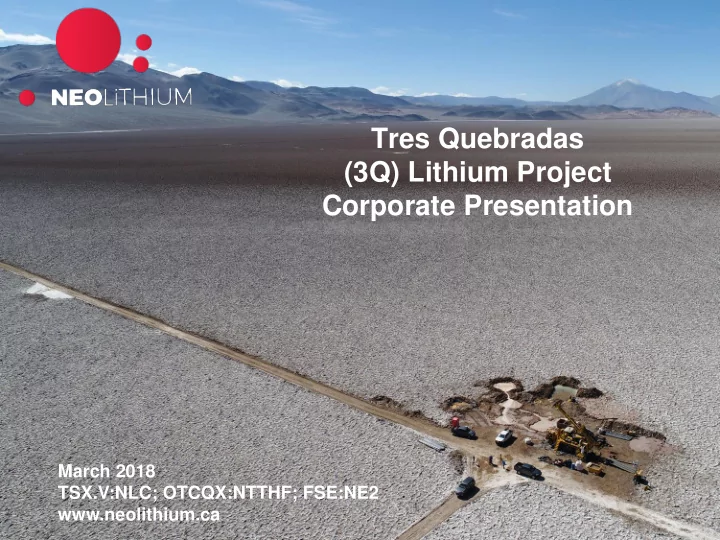
SLIDE 1
Tres Quebradas (3Q) Lithium Project Corporate Presentation
March 2018 TSX.V:NLC; OTCQX:NTTHF; FSE:NE2 www.neolithium.ca
Corporate Presentation March 2018 TSX.V:NLC; OTCQX:NTTHF; FSE:NE2 - - PowerPoint PPT Presentation
Tres Quebradas (3Q) Lithium Project Corporate Presentation March 2018 TSX.V:NLC; OTCQX:NTTHF; FSE:NE2 www.neolithium.ca Forward-Looking and Cautionary Statements This presentation is strictly confidential and intended to be strictly
March 2018 TSX.V:NLC; OTCQX:NTTHF; FSE:NE2 www.neolithium.ca
1
Forward-Looking and Cautionary Statements
This presentation is strictly confidential and intended to be strictly informational. The Company reserves the right, at its sole discretion, to modify all or any part of this presentation without any liability
Company as at the date hereof and are subject to uncertain events and circumstances which are beyond the control of the Company. Actual results could differ materially from those anticipated. You acknowledge that any reliance on or use by you of this information shall be at your own risk. In no event shall the Company, its directors, officers, employees, agents or advisors be liable for any damages of any kind arising out of or relating to the use of this presentation, including, but not limited to, any of loss of income or profits, incidental, special, indirect or consequential or any similar losses or damages, whether or not advised of the possibility of damages, and on any theory of liability, arising
constitute, nor should be construed as, an offer or solicitation of an offer for the purchase of any securities of the Company, nor investment advice or an offering memorandum. No securities commission or similar authority or stock exchange in any jurisdiction has in any way passed on any of the information contained herein. The results described herein are exploratory in nature and there can be no assurance that they are indicative of Mineral Resources as defined in accordance with National Instrument 43-101. The technical contents of this presentation have been reviewed and approved by
101”). Mr. Perez is CEO and President of the Company, and is a Ph.D in Geology with a technical background in mineral exploration, including lithium brines. Additional information on sample results and estimates at Tres Quebradas are available in the Company’s technical report titled “Technical Report on Tres Quebradas Lithium Project Catamarca Province, Argentina” with an effective date of June 6, 2016.
2
2One of the Best Undeveloped Lithium Projects in the World
Neo Lithium is well positioned to become the next large low cost lithium producer
Processing
and high calcium content
ate site of 3.8% lithium in brine
feed pilot plant
The Right Asset & Structure
insiders ~16%
Unique Resource
sulphate/magnesium impurities in the world
resources and <100m, significant high grade brine >600m
Inferred resource of 1.4Mt of LCE at 713 mg/L Lithium
Inferred resource of 2.3Mt of LCE at 567 mg/L Lithium
The Right People
full feasibility (CEO & 2 Directors)
experience and local knowledge, with over 10 engineers, chemists and PhDs
Why Neo Lithium?
Positive PEA
3
3Strong Capital Structure
TSX.V: NLC; OTCQX:NTTHF; FSE:NE2 $1.85 ~$215M Ticker Price (March 20, 2018) Market Capitalization 117.1M ~$58M (no debt) GMP ($3.25) - Cormark ($3.40) Canaccord ($3.25) Issued & Outstanding Shares Net Cash (Sep 30, 2017) Research Coverage 125.3M ~45%* ~16% FD Outstanding Shares Institutional Ownership Insider Ownership
Note: all numbers in Canadian dollars except per share data * Major shareholders include BlackRock, M&G, JPMorgan, RBIM, CCL, Manulife, Mackenzie, Sprott, Guardian
4
Resource, Processing & Fiscal Stability News 2016/17 Drilling Season Maiden Resource 2017/18 Drilling Season
Progress and Achievements
Neo Lithium has successfully delivered results and is on track to develop its 3Q Project
PEA
Property Acq. Go- Public $20M raised Full Exp/Dev Permits Team Strength Over $45M raised Ongoing Drilling, Processing, Other Technical Data Over $15M Invested EIA & Cons. Permits Q1-Q2 ‘18 Technical Team Strength Feasibility Study Q4 18 / Q1 19
5
Location
Chilean border with direct road to pacific ports
350km2 up to the border with Chile
complex
full feasibility
construction granted by mining authorities
provincial highway and a recently upgraded project road
6
3Q Project
complex that includes three brine reservoirs and three salars
world of a brine lake: Zhabuye (in China) and is a producing lithium mine
the project
high grade lithium and feed into the lakes and salars
communities in the area
the Company
7
Lithium Brine Reservoir and Salar Complex
8
8
grades and the lowest concentration of critical impurities
Lithium Rich Hot Springs Feed the Northern Target
9
Drilling – 2016/2017 Exploration Campaign Results
10
Resource Estimation
North South
Carbonate @ 733 mg/l Li
Carbonate @ 567 mg/l Li
estimation at 520 mg/l Li cut off
estimation at 400 mg/l Li cut off
In only one drilling season Neo Lithium was able to announce its maiden resource estimate for the 3Q Project
11
Depth of the Resource
potential at depth
Porosity 100% 18.6% 7.8% 9.8% 2.2% 6.3% Depth (metres) 2 35 70 100 200 >250
2.57% 2.32%
Resource %
12
Seismic Results
its kind in lithium brine exploration) along the entire 3Q salar and peripheral basins
eastwards
PP1-D-10
Halite Massive Halite
PP1-D-21 PP1-D-8
13
Seismic Work
Basement ? ? Massive Halite Halite
200
.
300 100 500 400 600 700
D-17 Arc. P.f. H.P. U.S. H.H. 156m 400m 44m 18m 0m 100m 200m 300m 492m 550m Ar. Fan 572m Arc. 500m 572m H.M.PP1-D-17 PP1-D-8
PP1-D-21 PP1-D-11
Lower Sediment Basement ?
14
Drilling – 2017/8 Campaign results
meters Li K Mg/Li Sulf/Li PP1-D-14* 304 642 6109 2,27 0,35 PP1-D-15* 222 785 7545 2,02 0,26 PP1-D-16 308 525 5353 2,32 0,58 PP1-D-17** 512 638 6668 1,91 0,41 PP1-D-18 56 1071 9486 1,78 0,33 PP1-D-20** 22 310 2935 1,51 1,61 PB1-R-15 30 816 8289 2,05 0,4 PB2-R-7 76 518 5683 7,59 0,50 PP2-D-16 42 644 6475 2,25 0,90
15
The brine is extracted from wells and sent to a 3 step pond process:
1. Pre-concentration ponds: where sodium, potassium and calcium chloride precipitate 2. Conditioning brine: where remaining Ca is removed by adding Na2SO4 to form gypsum. 3. Post-concentration Ponds: Li is concentrated until 6 % W/W with precipitate remaining salt such as sodium chloride, carnalite and gypsum
PEA Plan – Evaporation Plant at the Salar
Pre Concentration Ponds Post Concentration Ponds Tailings
16
solvent extraction process to extract the boron
Magnesium Removal
produce Lithium Carbonate
compaction, micronized and bagging
PEA Plan – Lithium Carbonate Plant in Fiambala
Finishing a battery grade lithium carbonate product
Fiambala Lithium Carbonate Plant Fiambala 3Q Project
17
3Q Project: Preliminary Economic Assessment Highlights
*EBITDA is a non-IFRS earnings measure which does not have any standardized meaning prescribed by IFRS and therefore may not be comparable to EBITDA presented by other companies. EBITDA represents earnings before interest expense, income taxes, depreciation and amortization. Investors are cautioned that this non-IFRS financial measure should not be construed as an alternative to other measures of financial performance calculated in accordance with IFRS.
PEA Highlights and Results
After-Tax Net Present Value ("NPV") @ 8% Discount Rate US$1,200 million After-Tax Internal Rate of Return ("IRR") 27.9% Capital Expenditures US$490.2 million Cash Operating Costs (per tonne of LCE) $2,791 Steady-state Annual Production (lithium carbonate) 35,000 Mine Life 20 years Steady-state annual EBITDA* (nameplate production) $310.1 million Payback Period (from commencement of production) 1 year 8 months
– Current average pricing is close to US$14,500/t (Source: Benchmark)
18
PEA – Capital Expenditures
Description US$ Million
Evaporation Ponds and Wells $178.4 Plant Facilities and Equipment $62.8 Infrastructure and Others $80.2 Direct Costs Subtotal $321.4 Indirect Costs $88.5 Contingency $80.3 Total Initial Capital Costs $490.2 Sustaining and Exploration Costs (life of mine) $41.0
US$/t of production ~US$13,000/t on a 35,000/yr production
US$13k - $17k per tonne of production due to our low impurity content
19
PEA – Operating Costs
Description US$000/yr US$/t Li2CO3
Direct Costs Chemical Reactives and Reagents $53,934 $1,541 Salt Removal and Transport $23,620 $675 Energy $10,820 $309 Manpower $4,713 $135 Catering and Camp Services $1,659 $47 Maintenance $1,570 $45 Direct Costs Subtotal $96,317 $2,752 Indirect Costs General and Administration $1,359 $39 Indirect Costs Subtotal $1,359 $39 Production Total Costs $97,677 $2,791
the cost curve
20
Low Base High
(US$ Million) CAPEX $490 $490 $490 Values, year 20 (US$ Million) Revenue $357 $414 $508 OPEX $98 $98 $98 EBIDTA $260 $317 $410 Pre Tax (US$ Million or otherwise noted) NPV 6% $1,889 $2,400 $3,307 NPV 8% $1,471 $1,889 $2,640 NPV 10% $1,148 $1,495 $2,125 IRR 29.5% 33.7% 41.4% PAYBACK 1 Y, 9 M 1 Y, 5 M 0 Y, 10 M After Tax (US$ Million or otherwise noted) NPV 6% $1,212 $1,545 $2,136 NPV 8% $927 $1,200 $1,691 NPV 10% $707 $933 $1,345 IRR 24.5% 27.9% 34.1% PAYBACK 1 Y, 11 M 1 Y, 8 M 1 Y, 2 M Price Case
PEA – Valuation Results (Lithium Carbonate Pricing Sensitivities)
*EBITDA is a non-IFRS earnings measure which does not have any standardized meaning prescribed by IFRS and therefore may not be comparable to EBITDA presented by other companies. EBITDA represents earnings before interest expense, income taxes, depreciation and amortization. Investors are cautioned that this non-IFRS financial measure should not be construed as an alternative to other measures of financial performance calculated in accordance with IFRS.
carbonate price
21
Lithium Market 2018
Lithium Carbonate Average Pricing Scenarios:
US$ 10,200
US$ 11,760
US$ 14,250
ended up in the “High” pricing level, placing our “Base Case” scenario as conservative
Source: Benchmark
Lithium Carbonate (US$/tonne), FOB South America
22
Global Lithium Cost Curve Estimate
NLC 3Q Project
and compare very well with advanced development projects
SQM (Chile) Albermarle (Chile/USA) FMC (Argentina) Orocobre (Argentina) Other Brine (China) Other Conversion (China) Talison (Tianqi/ALB China) $0 $1,000 $2,000 $3,000 $4,000 $5,000 $6,000 $7,000 $8,000 $9,000 30 60 90 120 150 180 210
Estimated Cash Cost (US$/t) Current Capacity (kt LCE)
LAC – Cauchari 2017 FS $2,495 Galaxy – Sal de Vida 2016 DFS $3,369 Source: Roskill, Global Lithium LLC and company information
23
ALB - Silver Peak Citic - W. Taijinar ILC - Mariana Energi - Rincon Uyuni ALB - Antofalla AAL - Cauchari LIX - Angeles LAC - Cauchari FMC - Hombre Muerto ML - Pastos Grandes 3Q Project GXY - Sal de Vida ALB - La Isla Zhabuye LPI/Bearing - Maricunga SQM/ALB - Atacama 10 20 30 40 50 60 70 5 10 15 20 25 30 35 40 SO4/Li Ratio Mg/Li Ratio
23Impurities & Cash Cost – Project Comparison
The 3Q Project compares very favourably to current producers and development projects
*
$ 5,500 $ 4,500 $ 3,500 Not feasible Feasible $2,500
pricing or current discussions of 60% royalty >$12,000/t
Source: company reports and industry research * Excludes by-products Acquired
24 0.0000 0.0200 0.0400 0.0600 0.0800 0.1000 0.1200 0.1400 0.1600 ALB - Silver Peak Citic - W. Taijinar ILC - Mariana Energi - Rincon Uyuni ALB - Antofalla LSC - Rio Grande LSC - Pozuelos AAL - Cauchari ML - Pastos Grandes LIX - Angeles LAC - Cauchari FMC - Hombre Muerto 3Q Project GXY - Sal de Vida Zhabuye LPI/Bearing - Maricunga SQM/ALB - Atacama Lithium %
24Lithium Grade Comparison
The 3Q Project ranks as one of the highest grade lithium projects in world
* Based on average composition of the Measured and Indicated Resource at 520 mg/L Cut off
*
Acquired
25
$90 EV/Resource $43 EV/Resource $367 EV/Resource $102 EV/Resource $110 EV/Resource $67 EV/Resource $66 EV/Resource $41 EV/Resource $125 EV/Resource 5,000,000 10,000,000 15,000,000 20,000,000 25,000,000 30,000,000 ALB - La Isla ALB - Silver Peak BRZ - Maricunga ILC - Mariana AAL - Cauchari LPI - Maricunga LIX - Angeles Citic - W. Taijinar LSC - Rio Grande / Pozuelos ML - Pastos Grandes 3Q Project FMC - Hombre Muerto GXY - Sal de Vida LAC - Cauchari Zhabuye Energi - Rincon Uyuni SQM/ALB - Atacama
Lithium Tonnes
Resource Size Comparison*
The 3Q Project is the 8th largest lithium project in the world
* Sized based on effective ownership of the resource Acquired
26 0.0x 0.1x 0.2x 0.3x 0.4x 0.5x 0.6x 0.7x 0.8x 0.9x 1.0x 1.1x 1.2x 1.3x 1.4x 1.5x Galaxy Resources Altura Mining Neometals Pilbara Minerals Critical Elements Bacanora Minerals Kidman Resources Nemaska Lithium Lithium X Orocobre Lithium Americas LSC Lithium Millennial Lithium Advantage Lithium Neo Lithium P/NAV
P/NAV Comparison – Company Analysis*
NLC is trading at a discount to lithium company peers
* Source: company information and research analyst ** Solid red bar based on PEA NPV 8% of US$1.1 million at 1.25 FX exchange rate and light red bar based on average research estimate
**
Average industry P/NAV of ~0.8x Acquired
27
Current Infrastructure
Project
weather road
28
Lithium Process Progress
and chemical team
achieved concentration levels of 3.8% lithium in brine
achieve this concentration PEA assumes >US$860/t
consequence of low impurities and high calcium content
molecules of water, decreasing the size
constructed to scale up the process and feed the pilot lithium carbonate plant
Calcium Chloride with 6 H20 3.8% Lithium Brine
29
Timeline
raised back into the project and now has an 18 month work plan which is fully funded to FS
.
Description
Q1 Q2 Q3 Q4 Q1 Q2 Q3 Q4 Q1 Q2 Q3 Q4 Q1 Q2 Q3 Q4 Inicial Sistematic Sampling First Report ` Road Upgrade Camp Construction
Drilling Season 1
Pump Tests Season 1 Experimental Ponds Construction (Ph 1+2) Evaporation cycle Environmental Base Line Program
Maiden Resource Estimate Preliminary Economic Assessment
Drilling Season 2 Pump Test Season 2 Updated Resource Estimate Lithium Carbonate Pilot Plant Construction Pilot Plant Operation
Feasibility Study
Financing Discussions Construction Decisicion 2016 2017 2018 2019
30
30The Right Management Team
production and 3 in development)
acquired through Lithium Americas Corp.,
Minerals Inc (LAT), Senior Geologist for Barrick Gold, IAMGOLD, Apex Geoscience and Opawica Exploration
Waldo Perez,
Ph.D. P. Geo. President & CEO
Carlos Vicens,
MBA – CFO
Banking Mining team and participated in +$10B of M&A transactions and +$5B in equity and debt issuances
Gabriel Pindar,
Director - COO
the development of mining projects and large scale infrastructure (rail and port) in Argentina, Peru, Mexico, Australia, Canada, West Africa and United Kingdom.
Constantine Karayannopoulos,
Chairman
member of the Advisory Board at the University of Toronto’s Department of Chemical Engineering and Applied Chemistry. He holds Bachelor and Master of Applied Science degrees in Chemical Engineering from the University of Toronto.
Executive Officer of Molycorp and President and Chief Executive Officer of Neo Material Technologies (Sold to Molycorp Corp for $1.3 B).
Thomas Pladsen,
Director
industry.
EPM Mining Ventures Inc., KWG Resources Inc., Northfield Capital Corporation and White Pine Resources Inc.
Paul Fornazzari,
B.Sc. LLM – Director
LLP
executive teams and investment dealers and acts for domestic and foreign clients in various industries
31
Why Neo Lithium?
Neo Lithium has discovered one of the most promising NEW lithium project in the world High Grade & Low Impurities 100% Owned Large Project Large Resource with Potential for Expansion Experienced Technical and Financial Team Simple Solar Evaporation Process Strong Results – PEA & Resource
33
De-Risking
Argentina has come a long way in the last 18 months since new Government and President Macri took over The institutional framework improved with clear respect for the rule of Law Favourable policies towards foreign investors is attracting capital Currency controls were lifted allowing free flow of funds Peso devaluated 50% lowering development costs Export taxes on mineral products were lifted Import restrictions were lifted Provinces are encouraged to attract mining investment Improved outlook on international credit promoting large infrastructure investments Strong support from national and provincial environmental agencies on Mining Politically-driven environmental activism is on retreat
Argentina Overview & Turn Around
3Q Project
35
Where does Lithium come from?
Triangle, Chile and Argentina) and in some parts of China (Tibet) while hard rock comes mostly from Australia and to a lesser extent in China as well
Brine Brine Brine Spodumene Spodumene Mix
Source: Roskill
36
Brine Mining
in farms) and leaving the brine to evaporate in large ponds
precipitate lithium carbonate
Albermarle Lithium Brine Operation
Pump Well Evaporation Pond Lithium Carbonate
37
Hard Rock Mining
the ore from the waste. Most producers sell spodumene (not lithium)
and then purified to produce Lithium Hydroxide or Carbonate
Open Pit 4 Crushed Shipped 3 Selected 2 Lithium Hidroxide 5
38
Other Sources of Lithium
–Nevada (USA-Lithium Americas) –Sonora (Mexico-Bacanora)
–Very high costs –High energy consumption –Clays require intense acid leaching, leaving an acid residue that is difficult to deal with
many years on this project
39
Some lithium Myths that require clarification
difficult
There are very few lithium mines and few lithium experts, making the whole new development process slower than expected
important players
into the battery production, it will take decades to replace it. Besides, lithium is ~5% of the battery cost, lithium is not a factor that requires replacement.
story, not a company story
41
Brazil 1% Portugal 2% Zimbabwe 3% USA 3% China 10% Argentina 11% Australia 33% Chile 37% Others 18% FMC 10% Tianqi 17% SQM 23% Albemarle 32%
Lithium Industry
Source: company reports, industry studies and market data
world supply which is estimated to be ~200kt
production steadily from spodumene purchased in Australia
42
Lithium Uses
Source: Deutche Bank
By the year 2025 it is expected that 70% of all lithium produced will end up in batteries
Glass-Ceramics Greases Air Treatment Polymer Medical Primary Battery Aluminium Casting Powders Others Batteries 0% 10% 20% 30% 40% 50% 60% 70% 80% 90% 100% 2013 2014 2015 2016 2017 2018 2019 2020 2021 2022 2023 2024 2025 Lithium demand by application (% of total demand)
~30% 70% 30%
electrochemical potential, which leads to excellent energy-to-weight performance
lithium in the last 4 years
43
Lithium Carbonate Prices
US$/T Lithium Carbonate Year Source: *Source: Gestión y Economía Minera Ltda, USGS-Industrial Minerals (1952-1990), Cochilco (1991-2009); inflation adjusted for 2008 except after 2009 and Neo Lithium forecast.
based on street research
uses US$12,000/t flat
44
Demand Outlook
200 300 400 500 600 700 800 2013 2014 2015 2016 2017 2018 2019 2020 2021 2022 2023 2024 2025 Lithium demand by application (LCE kt)
Non-battery demand Batteries (traditional markets) E-Bikes Electric Vehicles Energy Storage Bull Bear New Curve
stating much higher penetration numbers close to 25%
carbonate demand
(LCE kt) 1% 5% 10% 15% 25% 100% 500 1,000 1,500 2,000 2,500 3,000 3,500 4,000 4,500 0% 10% 20% 30% 40% 50% 60% 70% 80% 90% 100% % Penetration Lithium Carbonate Demand Electric Vehicle Penetration and Demand Electric Vehicle Penetration and Demand *Assumes an average of 50kg of lithium per EV
46
Penetration Rates
New York 1910 New York 1925
Source: John Hykawy.
47
The Cell Phone Story
2007 NiMH batteries Lithium Batteries
Lithium Carbonate Price
application is in the smartphone, brought to the market in 2007
smartphone did to lithium price?
smart phone made the price to triple in 2 years
48
Lithium is the Key Ingredient in Today’s Technology
Tesla Model S
U p t
0kg
Power Tools
Up to 60g
Tablet
Up to 30g
Electric Vehicles
Up to 65kg
Laptops
Up to 40g
Smartphones
Up to 3g
Hybrid EVs
U p t
kg
E-Bikes
Up to 1kg
Energy Storage
>500kg
49
Electrification of Transportation
2017 2020 2025 2030 2035 2040
No decision yet for EU or the USA China* Norway Germany ** France Netherlands ** India UK
London cabs
*In China EVs must be 10% of the OEMs car production in 2019, 12% in 2020. **Sugested, pending a decision
countries and cities in the near future
50
The Electric Car Revolution is Accelerating
Virtually all car manufacturers have launched or announced plans for electric vehicles
51
Contact or additional information: info@neolithium.ca www.neolithium.ca Headquarters: 401 Bay St, Suite 2702 Toronto, Ontario, Canada M5H 2Y4
3Q Project: The Next Major Lithium Discovery