
SLIDE 1
1
w w w . a s c e n d a n t r e s o u r c e s . c o m
T S X : A S N D
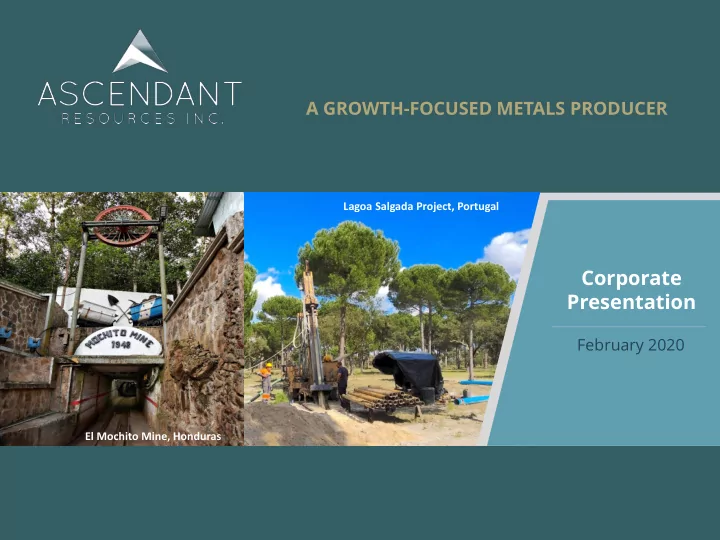
Corporate Presentation
February 2020
A GROWTH-FOCUSED METALS PRODUCER
El Mochito Mine, Honduras Lagoa Salgada Project, Portugal
Corporate Presentation February 2020 El Mochito Mine, Honduras w - - PowerPoint PPT Presentation
1 A GROWTH-FOCUSED METALS PRODUCER Lagoa Salgada Project, Portugal Corporate Presentation February 2020 El Mochito Mine, Honduras w w w . a s c e n d a n t r e s o u r c e s . c o m T S X : A S N D 2 Forward Looking Statements This
1
w w w . a s c e n d a n t r e s o u r c e s . c o m
T S X : A S N D
El Mochito Mine, Honduras Lagoa Salgada Project, Portugal
2
w w w . a s c e n d a n t r e s o u r c e s . c o m
T S X : A S N D
This presentation contains "forward-looking statements" and "forward-looking information" (collectively, "forward-looking information") within the meaning of applicable Canadian securities legislation. All information contained in this news release, other than statements of current and historical fact, is forward-looking information. Often, but not always, forward-looking information can be identified by the use
these or similar words) and statements that certain actions, events or results "may", "could", "would", "should", "might" "occur" or "be achieved" or "will be taken" (and variations of these or similar expressions). Forward-looking information is also identifiable in statements of currently occurring matters which may continue in the future, such as "providing the Company with", "is currently", "allows/allowing for", "will advance" or "continues to" or other statements that may be stated in the present tense with future implications. All of the forward-looking information in this presentation is qualified by this cautionary note. Forward-looking information is based on, among other things, opinions, assumptions, estimates and analyses that, while considered reasonable by Ascendant at the date the forward-looking information is provided, inherently are subject to significant risks, uncertainties, contingencies and other factors that may cause actual results and events to be materially different from those expressed or implied by the forward-looking information. Forward-looking statements involve known and unknown risks, uncertainties, contingencies and other factors that may cause actual results and events to be materially different from those expressed or implied by the forward-looking information. The risks, uncertainties, contingencies and other factors that may cause actual results to differ materially from those expressed or implied by the forward-looking information may include, but are not limited to, risks generally associated with the mining industry, such as economic factors (including future commodity prices, currency fluctuations, energy prices and general cost escalation), uncertainties related to the development and operation of Ascendant's projects, dependence on key personnel and employee and union relations, risks related to political or social unrest or change, rights and title claims, operational risks and hazards, including unanticipated environmental, industrial and geological events and developments and the inability to insure against all risks, failure of plant, equipment, processes, transportation and other infrastructure to operate as anticipated, compliance with government and environmental regulations, including permitting requirements and anti-bribery legislation, volatile financial markets that may affect Ascendant's ability to obtain additional financing on acceptable terms, the failure to obtain required approvals or clearances from government authorities on a timely basis, uncertainties related to the geology, continuity, grade and estimates of mineral reserves and resources, and the potential for variations in grade and recovery rates, uncertain costs of reclamation activities, tax refunds, hedging transactions, as well as the risks discussed in Ascendant's most recent Annual Information Form on file with the Canadian provincial securities regulatory authorities and available at www.sedar.com. Should one or more risk, uncertainty, contingency or other factor materialize or should any factor or assumption prove incorrect, actual results could vary materially from those expressed or implied in the forward-looking information. Accordingly, the reader should not place undue reliance on forward-looking information. Ascendant does not assume any
except as required by applicable law. The information concerning the Company’s mineral properties has been prepared in accordance with National Instrument 43-101 (“NI-43-101”) adopted by the Canadian Securities Administrators. In accordance with NI-43-101, the terms “Mineral Reserves”, “Proven Mineral Reserve”, “Probable Mineral Reserve”, “Mineral Resource”, “Measured Mineral Resource”, “Indicated Mineral Resource” and “Inferred Mineral Resource” are defined in the Canadian Institute of Mining, Metallurgy and Petroleum (the “CIM”) Definition Standards for Mineral Resources and Mineral Reserves adopted by the CIM Council on May 10, 2014. While the terms “Mineral Resource”, “Measured Mineral Resource”, “Indicated Mineral Resource” and “Inferred Mineral Resource” are recognized and required by NI 43-101, the U.S. Securities Exchange Commission (“SEC”) does not recognize them. The reader is cautioned that, except for that portion of mineral resources classified as mineral reserves, mineral resources do not have demonstrated economic value. Inferred Mineral Resources have a high degree of uncertainty as to their existence and as to whether they can be economically or legally mined. It cannot be assumed that all or any part of any Inferred Mineral Resource will ever be upgraded to a higher category. Therefore, the reader is cautioned not to assume that all or any part of an Inferred Mineral Resource exists, that it can be economically or legally mined, or that it will ever be upgraded to a higher category. Likewise, you are cautioned not to assume that all or any part of a measured or Indicated Mineral Resource will ever be upgraded into Mineral Reserves. Readers should be aware that the Company’s financial statements (and information derived therefrom) have been prepared in accordance with International Financial Reporting Standards (“IFRS”) as issued by the International Accounting Standards Board and are subject to Canadian auditing and auditor independence standards. IFRS differs in some respects from United States generally accepted accounting principles and thus the Company’s financial statements (and information derived therefrom) may not be comparable to those of United States companies. Unless otherwise indicated, all dollar values herein are in US$.
3
w w w . a s c e n d a n t r e s o u r c e s . c o m
T S X : A S N D
w w w . a s c e n d a n t r e s o u r c e s . c o m
T S X : A S N D
A Compelli pelling Growth-Focused Investment Opportunity
large resource base remains open in all directions
growth opportunities like Lagoa Salgada
4
w w w . a s c e n d a n t r e s o u r c e s . c o m
T S X : A S N D
Achieved Significant Growth and Multiple Milestones in Just Three Years
and 2-year payback, reducing AISC by 26% to $0.97/lb ZnEq
5
w w w . a s c e n d a n t r e s o u r c e s . c o m
T S X : A S N D
High-Grade VMS Deposit in the Prolific Iberian Pyrite Belt
80%.*
significant exploration upside.
multiple world class mines that have been transformational for Lundin Mining (Neves Corvo) and Trafigura (Aguas Tenidas).
with strong community and government support.
demonstrates large and high-grade deposit and with significant near-term growth and development potential.
tax NPV8% of $US106M and IRR of 31%.
*Ascendant acquired a 25% interest in Redcorp – Empreendimentoes Mineirs, LDA., which owns an 85% interest in the Lagoa Salgada Project as well as acts as the operating entity. Ascendant has an option to increase its interest to 80% upon completion of certain milestones and payments.
5
ALJUSTREL NEVES CORVO AGUAS TENIDAS LAGOA SALGADA PROJECT
Copper-rich Iberian Pyrite Belt
RIO TINTO GRUPO MEXICO FIRST QUANTUM
Atlantic Copper Smelter
5
6
w w w . a s c e n d a n t r e s o u r c e s . c o m
T S X : A S N D
Robust Economics Demonstrated for the North Zone, Stated on a 100% Basis
PEA Key Highlights
Project IRR pre-tax 37% NPV8% pre-tax $ 137 million Project IRR after-tax 31% NPV8% after-tax $ 106 million Life of mine pre-tax cash flow $ 250 million Life of mine after-tax cash flow $ 202 million Construction period 2 years Payback period 4 years Life of mine 9 years Avg Annual Production 1.0 million tonnes Initial Capital Expenditure
(Including Contingency of $37.55 million)
$ 162.7 million LOM Sustaining Capital Expenditure $ 20.2 million Avg annual operating costs $ 49.43 /t milled Avg Annual operating costs (C1) $0.44 /lb ZnEq Avg Annual All-In Sustaining Costs (AISC) $0.66 /lb ZnEq
Note: Within 45 days of Ascendant’s press release dated January 14, 2020, reporting the results of the PEA, the Company will file with regulatory authorities a Technical Report prepared in accordance with NI 43-101 that documents the PEA study and supports the current disclosure.
.
7
w w w . a s c e n d a n t r e s o u r c e s . c o m
T S X : A S N D
Effective September 5, 2019, Stated on a 100% Basis
Average Grade Contained Metal Deposit Category Min Cut-off Tonnes Cu Zn Pb Sn Ag Au ZnEq AuEq Cu Zn Pb Sn Ag Au Zones ZnEq% (kt) (%) (%) (%) (%) (g/t) (g/t) (%) (g/t) (kt) (kt) (kt) (kt) (koz) (koz) North Measured(M) GO 2.5 234 0.13 0.70 4.32 0.36 51 1.50 11.38 7.18 0.3 1.6 10.1 0.9 385.2 11.3 Indicated(I) GO 2.5 1,462 0.08 0.43 2.55 0.26 37 0.51 6.63 4.18 1.2 6.2 37.3 3.8 1,742.1 23.8 M & I GO 2.5 1,696 0.09 0.47 2.79 0.27 39 0.64 7.28 4.60 1.5 7.9 47.4 4.6 2,127.2 35.1 Inferred GO 2.5 831 0.08 0.48 2.62 0.17 27 0.37 5.66 3.57 0.7 4.0 21.8 1.4 727.6 9.9 Measured(M) MS 3.0 2,444 0.40 3.12 2.97 0.15 72 0.74 10.95 6.91 9.7 76.3 72.5 3.7 5,623.9 58.4 Indicated(I) MS 3.0 5,457 0.45 2.35 2.30 0.13 75 0.67 9.55 6.03 24.5 128.1 125.6 7.3 13,221.5 116.9 M & I MS 3.0 7,902 0.43 2.59 2.51 0.14 74 0.69 9.98 6.30 34.2 204.4 198.1 10.9 18,845.5 175.2 Inferred MS 3.0 1,529 0.23 1.96 1.32 0.09 45 0.49 6.36 4.01 3.6 30.0 20.2 1.4 2,219.7 24.0 Measured(M) Str 2.5 94 0.37 0.88 0.28 0.05 17 0.12 3.08 1.94 0.3 0.8 0.3 0.0 51.0 0.4 Indicated(I) Str 2.5 643 0.34 0.90 0.23 0.09 17 0.06 3.23 2.04 2.2 5.8 1.5 0.6 354.0 1.3 M & I Str 2.5 737 0.34 0.90 0.24 0.09 17 0.07 3.21 2.03 2.5 6.6 1.7 0.6 405.0 1.7 Inferred Str 2.5 142 0.24 1.12 0.39 0.04 17 0.09 2.95 1.86 0.3 1.6 0.6 0.1 75.6 0.4 North M & I All Zones 2.9 10,334 0.37 2.12 2.39 0.16 64 0.64 9.06 5.72 38.2 219.0 247.2 16.2 21,377.7 212.0 North Inferred All Zones 2.8 2,502 0.18 1.42 1.70 0.12 38 0.43 5.93 3.74 4.6 35.6 42.6 2.9 3,022.8 34.3
Notes: (1) Mineralized Zones, GO=Gossan, MS=Massive Sulphide, Str=Stringer, Str/Fr=Stockwork (2) ZnEq% = ((Zn Grade*25.35)+(Pb Grade*23.15)+(Cu Grade * 67.24)+(Au Grade*40.19)+(Ag Grade*0.62)+(Sn Grade*191.75))/25.35 (3) CuEq% = ((Zn Grade*25.35)+(Pb Grade*23.15)+(Cu Grade * 67.24)+(Au Grade*40.19)+(Ag Grade*0.62))/67.24 (4) AuEqg/t = ((Zn Grade*25.35)+(Pb Grade*23.15)+(Cu Grade * 67.24)+(Au Grade*40.19)+(Ag Grade*0.62) )+(Sn Grade * 191.75))/40.19 (5) Densities: GO=3.12, MS=4.76, Str=2.88, Str/Fr=2.88 (6) Metal Prices: Cu $6,724/t, Zn $2,535/t, Pb $2,315/t, Au $1,250/oz, Ag $19.40/oz, Sn $19,175/t (7) The Mineral Resource content for Lagoa Salgada was completed and approved by Charley Murahwi, M.Sc., P.Geo., Pr. Sci. Nat., FAusIMM, Senior Geologist, Micon International Ltd.
Average Grade Contained Metal Deposit Category Min Cut-off Tonnes Cu Zn Pb Sn Ag Au CuEq Cu Zn Pb Sn Ag Au Zones CuEq% (kt) (%) (%) (%) (%) (g/t) (g/t) (%) (kt) (kt) (kt) (kt) (koz) (koz) Central Inferred Str 0.9 1,707 0.15 0.16 0.06 12 2.22 1.66 2.5 2.7 1.0 — 635.2 121.9 South Measured(M) Str/Fr 0.9 — — — — — — — Indicated(I) Str/Fr 0.9 2,473 0.47 1.53 0.83 0.00 19 0.06 1.54 11.5 37.9 20.6 0.0 1,484.7 4.7 South M & I Str/Fr 0.9 2,473 0.47 1.53 0.83 0.00 19 0.06 1.54 11.5 37.9 20.6 0.0 1,484.7 4.7 South Inferred Str/Fr 0.9 6,085 0.40 1.34 0.80 0.00 17 0.05 1.37 24.6 81.6 48.7 0.0 3,285.2 10.0
8
w w w . a s c e n d a n t r e s o u r c e s . c o m
T S X : A S N D
Robust Economics Demonstrated in PEA for the North Zone
sulphide
5.9% ZnEq from only 60 holes totaling 13,380 metres of drilling
along strike and at depth Massive Sulphide Stockwork Zone
Surface Tertiary Cover (140 m) Gossan cap 5-20m thick Vertical Distance (360 m)
9
w w w . a s c e n d a n t r e s o u r c e s . c o m
T S X : A S N D
Robust Economics Demonstrated for the North Zone, Stated on a 100% Basis
stoping method with pastefill
concentrates including lead, zinc, copper and tin, as well as gold and silver doré
Surface 30m deep box cut access to the portal The access portal Single decline from surface at 12.6% gradient Ramp from portal until sulphide base Ramp from sulphide base until stockwork base Raise-bored holes to surface for ventilation and secondary escape ways
10 10
w w w . a s c e n d a n t r e s o u r c e s . c o m
T S X : A S N D
Significant Growth Achieved Since Acquisition of Interest
Increase in reported inferred tonnage from 2018 – Q3 2019
Increase in reported measured & indicated tonnage from 2018 – Q3 2019 Reporting of a measured value in Q1 2019
1,982 1,554 2,942 3,920 5,700 12,823 1,761 6,082
Inferred Indicated Measured
10,295 2,772
10,035
11 11
w w w . a s c e n d a n t r e s o u r c e s . c o m
T S X : A S N D
Lagoa Salgada and Operating Mines in the Belt
Aljustrel Tonnage (tonnes) Cu (%) Pb (%) Zn (%) Ag (g/t) Reserves 14,794,000 0.43 5.08 1.63 57.47 M& I 17,282,000 0.84 1.41 4.35 45.70 Inferred 12,828,000 0.61 1.36 4.34 42.26 Neves-Corvo Tonnage (tonnes) Cu (%) Pb (%) Zn (%) Ag (g/t) Reserve 60,733,000 1.30 4.20 1.00 50.01 M& I 104,760,000 1.03 0.82 4.00 54.30 Inferred 32,353,000 1.49 0.49 2.195 40.96 Aguas Tenidas Tonnage (tonnes) Cu (%) Pb (%) Zn (%) Ag (g/t) Au (g/t) Reserves 19,210,000 1.69 3.94 1.16 49.51 0.62 M& I 2,820,000 1.80 0.10 0.20 7.20 0.10 Inferred 10,620,000 2.02 0.76 2.57 46.11 0.63
Lagoa Salgada Tonnage (tonnes) Cu (%) Pb (%) Zn (%) Sn (%) Ag (g/t) Au (g/t)
M& I 12,807,000 0.39 2.09 2.01 0.13 55.52 0.53 Inferred 10,295,000 0.31 0.9 1.16 0.03 20.98 0.50
La Zarza Tonnage (tonnes) Cu (%) Pb (%) Zn (%) Ag (g/t) Au (g/t) M&I 9,880,000 1.00 1.00 3.00 38.90 1.60 Las Cruces Tonnage (tonnes) Cu (%) Pb (%) Zn (%) Ag (g/tonne) Au (g/tonne) Reserves 3,100,000 4.51 NA NA NA NA M&I 3,400,000 1.57 2.74 NA 63.76 2.14 Inferred 36,000,000 1.11 1.25 2.64 28.94 NA Source: S&P Global Market Intelligence (snl.com)
12 12
w w w . a s c e n d a n t r e s o u r c e s . c o m
T S X : A S N D
Building on a Successful 2018 Program Doubling Total Tonnes
Successful 2019 program further expanded high-grade mineralization & significantly upgraded the Mineral Resource Estimate 2019 Diamond Drilling Highlights:
and upgrading confidence of North Zone
mineralization the North Zone substantially contributing to updated Mineral Resource Estimate in Sept 2019
Central & South Zones; a characteristic present in many major VMS deposits in the IPB.
anomaly and remain open along strike and at depth.
13 13
w w w . a s c e n d a n t r e s o u r c e s . c o m
T S X : A S N D
2019 Drill Program Results
1 Refer to tables in the press release dated July 24, August 13 and September 3, 2019 for true widths estimated from actual drilled lengths. 2 ZnEq% was calculated as follows: ZnEq% = ((Zn Grade*25.35)+(Pb Grade*23.15)+(Cu Grade * 67.24)+(Au Grade*40.19)+(Ag Grade*0.62)+Sn Grade*191.75)/25.35 3 Metal prices used: US$1.15/lb Zn, US$1.05/lb Pb, $3.05/lb Cu, US$8.70/lb Sn, US$19.40/oz Ag, and 1,250/oz Au. No recoveries were applied.
Key Highlights (true width) Include:
Gossan: LS_MS_26 - 9.1m at 0.16% Cu, 9.79% Pb, 1.13% Zn, 2.54g/t Au, 37.64g/t Ag and 0.39% Sn (16.52% ZnEq) LS_MS_30 - 13.4m at 0.06% Cu, 5.99% Pb, 0.33% Zn, 3.95g/t Au, 16.56g/t Ag and 0.61% Sn (13.19% ZnEq) Massive Sulphide: LS_MS_33 - 24.9m at 0.42% Cu, 6.56% Pb, 5.76% Zn, 1.17g/t Au, 184.84g/t Ag and 0.23% Sn (21.09% ZnEq) LS_MS_36 - 20.3m at 0.23% Cu, 6.14% Pb, 9.76% Zn, 1.42g/t Au, 104.65g/t Ag and 0.19% Sn (22.61% ZnEq) LS_MS_35 - 37.6m at 0.25% Cu, 4.10% Pb, 6.87% Zn, 1.19g/t Au, 99.42g/t Ag and 0.17% Sn (17.21% ZnEq) LS_MS_22 - 60.1m at 0.46% Cu, 2.91% Pb, 3.70% Zn, 0.77g/t Au, 81.04g/t Ag and 0.11% Sn (11.62% ZnEq) LS_MS_25 - 19.6m at 0.21% Cu, 5.23% Pb, 5.76% Zn, 1.29g/t Au, 137.32g/t Ag and 0.23% Sn (18.32% ZnEq) LS_MS_39 - 36.2m at 0.39% Cu, 6.26% Pb, 7.30% Zn, 1.37g/t Au, 165.63g/t Ag and 0.20% Sn (21.90% ZnEq) LS_MS_38 - 35.2m at 0.19% Cu, 2.28% Pb, 4.01% Zn, 0.70g/t Au, 47.98g/t Ag and 0.13% Sn (9.84% ZnEq) Stockwork: LS_ST_16 - 130.6m at 0.32% Cu, 0.82% Pb, 1.50% Zn, 0.04g/t Au, 12.89g/t Ag and 0.01% Sn (1.33% CuEq) Including - 26.7m at 0.58% Cu, 1.13% Pb, 2.66% Zn, 0.03g/t Au, 24.78g/t Ag and 0.01% Sn (2.24% CuEq)
14 14
w w w . a s c e n d a n t r e s o u r c e s . c o m
T S X : A S N D
Geophysics Work has Contributed Significantly to Successful Drilling
200-300m wide chargeability anomaly covering the North, South and Central Zones that make up the Mineral Resource Deposits, located in LS West area.
proven by success in extension massive sulphides in North Zone.
Zones associated with gravity anomaly.
and future target east of the Stockwork Zone.
North, LS East and Rio de Moinhos areas covering a potential strike length of 8km.
REGIONAL RESIDUAL BOUGUER GRAVITY MAP 8 km Anomaly
Tremendous success achieved correlating results to anticipated mineralization with Induced Polarization (IP).
North Zone (massive suphide) Central & South Zone (stockwork)
15 15
w w w . a s c e n d a n t r e s o u r c e s . c o m
T S X : A S N D
IP Resistivity and Chargeability Anomalies Indicate Significant Potential for Growth in the North Zone
Massive Sulphide mineralization known from the 2019 providing confidence in potential of increasing the size
mineralization
the 2019 drilling and a peak in chargeability that extends more than 150 m south and 100m deeper than the massive sulphide mineralization defined in the current resource
16 16
w w w . a s c e n d a n t r e s o u r c e s . c o m
T S X : A S N D
IP Anomalies Identify Potential for Connecting Known Zones and Identify Prospective Future Targets
Extending beyond the known mineral deposits:
surface with a total of 74.4 line-kilometers measured to develop a broad but complex IP map of a large portion of the property
identifying highly prospective future drilling targets Connecting the North, Central and South Zones:
conductor that extends for approximately 1.7 km, linking the North and South-Central Resources
gravity data also indicate increased mass
17 17
w w w . a s c e n d a n t r e s o u r c e s . c o m
T S X : A S N D
Zinc-Lead-Silver Mine
million tonnes ZnEq over its lifetime. (~8 MM ozs AuEq)
higher end of guidance range of 90-110 MM lbs ZnEq.
remaining open in most directions.
majority unexplored.
N.V./Trafigura – 7 years remaining
Typical NSR breakdown: Zn 70% Pb 20%
Ag 10%
18 18
w w w . a s c e n d a n t r e s o u r c e s . c o m
T S X : A S N D
Las Vegas, Honduras
El Mochito Mine, Honduras ( 100% )
Underground Zn/Pb/Ag mine on an 11,000 hectare land package, operating since 1948
mining industry (2 mines) represented 4% of GDP in 2015.
mining.
re-elected in 2017.
autonomy.
losses available for 2018/2019).
19 19
w w w . a s c e n d a n t r e s o u r c e s . c o m
T S X : A S N D
Continued Year Over Year Improvements at El Mochito
ZnEq Production (kt) Tonnes Milled (kt) Cost/Tonne Milled (US$/t) Reserves (Contained ZnEq, kt)
24.9 30.0 41.5 2016A 2017A 2018A 515.6 656.3 756.0 2016A 2017A 2018A $112.0 $88.2 $76.9 2016A 2017A 2018A 165.5 381.5 2016A 2018A
67% Increase 47% Increase 31% Decrease 131% Increase
2016 2017 2018 2016 2017 2018 2016 2017 2018 2016 2017
20 20
w w w . a s c e n d a n t r e s o u r c e s . c o m
T S X : A S N D
Continuous Improvements in 2019
$0.00 $10.00 $20.00 $30.00 $40.00 $50.00 $60.00 $70.00 $80.00 $90.00 $100.00 5,000,000 10,000,000 15,000,000 20,000,000 25,000,000 30,000,000
Q1/17 Q2/17 Q3/17 Q4/17 Q1/18 Q2/18 Q3/18 Q4/18 Q1/19 Q2/19 Q3/19 Q4/19
Contained Zinc Production (lbs) Contained Lead Production (lbs) Zinc Equivalent Production (lbs)
in Q4 2019 with contained metal production of 29.4 M ZnEq lbs 2019 annual production of 106.2 M ZnEq lbs; up 16% over 2018
per ZnEq payable pound in Q3 2019; mine site AISC of $1.09 and consolidated AISC of $1.13
Higher grades in 2019 a key driver in annual production over 2018
21 21
w w w . a s c e n d a n t r e s o u r c e s . c o m
T S X : A S N D
Growth Driven by Discipline and Grade
Operating Data Guidance Actual ual Contained Metals: Zinc Equivalent Metal 90 – 110 million lbs 106.2 million lbs Zinc 65 – 75 million lbs 64.2 million lbs Lead 21 – 26 million lbs 27.1million lbs Silver 0.85 – 1.2 million ozs 1.4 million ozs Other Operating Assumptions Direct Operating Costs $70 – $80 / tonne Capital Expenditure $15 – $20 million
22 22
w w w . a s c e n d a n t r e s o u r c e s . c o m
T S X : A S N D
Opportunity for Robust Growth and Expansion of El Mochito
Table of Key Project Highlights
Project IRR* 58% Project NPV (8%) $83.0 million Project undiscounted after-tax cash flow $146.5 million Project construction period 2 years Project payback period 2 years Life of mine 10 years Average annual ZnEq metal production 120 million lbs Project development capex $32.8 million LOM sustaining capex (excluding closure) $129.7 million Average annual op costs post construction $61.85/t milled Average annual op costs post construction $0.58/lb ZnEq Payable Average annual AISC post construction $0.97/lb ZnEq payable
Three Key Areas of Focus: Mining Operations Expansion:
capacity and shortened hauling distances.
Processing Plant Upgrades:
tailings to meet increased production.
Improved underground water management system:
water management system.
*Stated on an after tax and royalty basis Notes: Based on metal price assumptions of $1.21/lb zinc, $1.09/lb lead and $15/oz silver. The PEA is effective October 22, 2018 and is available on SEDAR and the Company’s website.
Project financing in advanced stages
23 23
w w w . a s c e n d a n t r e s o u r c e s . c o m
T S X : A S N D
Opportunity for Robust Growth and Expansion of El Mochito
Revised haulage route Current haulage route Revised haulage route
Bulk of Mineral Resource Estimate located below the current shaft bottom, currently requiring lengthy haulage routes New subvertical shaft; haulage distances significantly decreased.
24 24
w w w . a s c e n d a n t r e s o u r c e s . c o m
T S X : A S N D
Significant Mineral Resource Estimate with Significant Growth Potential
El Mochito Mineral Resource Estimate – Effective 01 January 2018
Category Tonnes Grade Contained Metal (kt) Zn (%) Pb (%) Ag (g/t) ZnEq. (%) Zn Mlbs Pb Mlbs Ag Moz ZnEq. Mlbs Measured Resources 1,100 5.5 2.0 65 8.2 134 48 2.3 198 Indicated Resources 6,452 5.2 1.7 41 7.2 735 241 8.4 1,019 Measured & Indicated Resources 7,553 5.2 1.7 44 7.3 869 289 10.7 1,216 Inferred Resources 4,972 5.1 1.4 33 6.7 556 156 5.4 739
Notes: (1) Tonnage, grade and contained metal values have been rounded, totals may vary due to rounding. (2) Price assumptions used were US$1.21/lb Zn, US$1.06/lb Pb and US$18/troy oz Ag. Zinc equivalent metal grade (ZnEq. %) was calculated as follows: Zn% +(Pb % x 0.82) +(Ag g/t x 0.0149) = ZnEq% and is based on 88.9% Zn recovery, 74.3% Pb recovery and 77.7% Ag recovery. (3) A cut-off of 3.1% ZnEq. was used to estimate Mineral Resources and is based on fourth quarter 2017 marginal direct operating costs. (4) Results of an interpolated bulk density deposit model have been applied, and contributing 5ft downhole assay composites were capped at 38% Zn, 36% Pb and 2000g/t Ag. (5) Mineral Resources that are not Mineral Reserves do not have demonstrated economic viability. (6) The Inferred Mineral Resource in this estimate has a lower level of confidence than that applied to an Indicated Mineral Resource and must not be converted to a Mineral Reserve. It is reasonably expected that the majority of the Inferred Mineral Resource could be upgraded to an Indicated Mineral Resource with continued exploration. (7) The Mineral Resource content of the El Mochito mine was completed by Michael Cullen, P. Geo. of Mercator Geological Services Limited, Mr. Cullen supervised and is responsible for the Mineral Resource Estimate and is an “Independent Qualified Person” as defined by NI 43-101. For further details on the El Mochito Mineral Resource Estimate effective January 01, 2018, please refer to the Technical Report on the Company’s website or SEDAR www.sedar.com.
25 25
w w w . a s c e n d a n t r e s o u r c e s . c o m
T S X : A S N D
Ongoing Program Focused Further Growth and New Discoveries
(historical grades in excess of 25% ZnEq).
bodies with a near-term focus on the new Esperanza tunnel.
potential.
with current IP work taking place.
work, both near-mine and regional.
26 26
w w w . a s c e n d a n t r e s o u r c e s . c o m
T S X : A S N D
Key Areas Optimizing Existing Development
Esperanza Port Royal Santa Elena Deep North Deep East Nueva Este Palmar
Dyke Trend Defined Faults Targeted Exploration Areas Planned Drill Holes Development Planned Development Ore Body
Victoria Nispero and Upper San Juan
Included in 2017 drill results: Deep East Manto: 6.4% ZnEq Deep North Manto: 6.8% ZnEq Historical Results: Port Royal Chimney: 17.25% ZnEq Imperial Trend Targets 8% - 17% ZnEq 700m drift open area to exploration Dec 2015 Estimations: Palmar: 9.1% - 13.8% ZnEq Victoria: 6.95 – 7.4% ZnEq
27 27
w w w . a s c e n d a n t r e s o u r c e s . c o m
T S X : A S N D
Known Targets Discovered by Past Surface Exploration Activities
Lake Yojoa
Valid Concessions Known Targets Fault Lines Existing Orebodies Being Mined
Manzanal:
Salva Vida Trend:
Caliche:
tunnel
Soledad:
Big Fuzzy:
Porvenir Trend:
1 2 Km
28 28
w w w . a s c e n d a n t r e s o u r c e s . c o m
T S X : A S N D
Ascendant Resources Inc.
Share Price (C$, as at Feb 14/20) $0.28 Shares Issued / Outstanding (MM’s) 77.7 Shares Fully Diluted (MM’s) 98.3 Estimated Float ~30% Market Capitalization (C$MM) $21.8 MMCAP Asset Management 16.99% Steve Laciak 15.25% CQS LLP 12.26% Vertex One Asset Management 9.49% Directors and Management approx. 16.4%*
Stock Symbol TSX: ASND
*fully diluted basis
Matthew O’Keefe Cantor Fitzgerald Stefan Ioannou Cormark Securities Gabriel Gonzalez Echelon Wealth Partners Ian Parkinson GMP Securities Heiko F. Ihle H.C. Wainwright & Co. Ryan Hanley Laurentian Bank Securities
29 29
w w w . a s c e n d a n t r e s o u r c e s . c o m
T S X : A S N D
Experienced Management Team
w w w . a s c e n d a n t r e s o u r c e s . c o m
T S X : A S N D OTCQX: ASDRF
acquisition and advancement of Lagoa Salgada Strong and Growing Production Base
expansion and long-term growth with the development of Lagoa Salgada Undervalued Investment Opportunity
Exploration Upside Potential
Mineral Resource base with significant near-term growth opportunities Mitigated Risks
Mochito; concurrently in advanced negotiations with additional lenders
A Unique Investment Opportunity
30 30
w w w . a s c e n d a n t r e s o u r c e s . c o m
T S X : A S N D
w w w . a s c e n d a n t r e s o u r c e s . c o m
T S X : A S N D OTCQX: ASDRF
El Mochito expansion; cost reduction, production growth and profitability Lagoa Salgada PEA demonstrates robust economics and significant potential for optimization
Lagoa Salgada: successful 2019 exploration program significantly upgrades and expanded Mineral Resource in Sept 2019 update with PEA completed El Mochito: Continued exploration to expand significant, high-grade Mineral Resource with recent access to new, untested areas of the mine
Maximize profitability and shareholder value; organic growth and accretive opportunities Success of El Mochito & Lagoa Salgada demonstrate teams’ ability to identify unique high- impact opportunities
Multiple Avenues for Growth
31 31
w w w . a s c e n d a n t r e s o u r c e s . c o m
T S X : A S N D
32 32
w w w . a s c e n d a n t r e s o u r c e s . c o m
T S X : A S N D
CHRIS BUNCIC, MBA, CFA, P. Eng – PRESIDENT, CEO, AND DIRECTOR | Mr. Buncic is one of the founding partners of Ascendant Resources Inc. and
its acquisition of the company’s flagship operating El Mochito mine from Nyrstar NV in 2016. Prior to cofounding Ascendant, Mr. Buncic served in senior management roles at several Canadian corporations in the technology and resources sectors. His depth of experience also includes six years in Institutional Equity Research at Cormark Securities Inc. and Mackie Research Capital Corporation. Mr. Buncic is a CFA Charterholder, has an MBA from Schulich School of Business and B.A.Sc. from the University of Toronto.
CLIFF HALE-SANDERS, MBA, CFA – EXECUTIVE VICE PRESIDENT | Mr. Hale Sanders is one of the founding of Ascendant Resources Inc. and its
acquisition of the company’s flagship operating El Mochito mine from Nyrstar NV in 2016. Mr. Hale Sanders’ career has spanned approximately 20 years in the capital markets industry working as a leading Base Metals and Bulk Commodities research analyst in Canada working at RBC Capital Markets, TD Securities, CIBC World Markets and Cormark Securities. Mr. Hale-Sanders holds a B.Sc. in Geology and Chemistry, an MBA from McMaster University and is a CFA Charterholder.
NEIL RINGDAHL – CHIEF OPERATING OFFICER | Mr. Ringdahl is a senior mining executive with over 23 years of international mining, development,
and executive management experience. Mr. Ringdahl has a strong technical background in a career that has been primarily focussed on underground and open pit mining in Latin America and Africa. Previously, Mr. Ringdahl held the roles of Chief Operating Officer at Orvana Minerals Corp. and Chief Executive Officer at Apogee Silver. Prior to this, Mr. Ringdahl has held various senior positions with Korea Zinc, Volcan Companía Minera, Anglo Platinum, and AngloGold. Mr. Ringdahl holds a bachelor's degree with Honors in mining engineering from the University of the Witwatersrand in South Africa.
ROHAN HAZELTON, CPA, CA – CHIEF FINANCIAL OFFICER | Mr. Hazelton is a Chartered Professional Accountant with over 20 years of international
finance experience including 15 years in the mining sector. Has was formerly Vice President, Strategy at Goldcorp Inc. where he held a variety of roles including Vice President Finance, Chief Financial Officer of Mexican Operations and Corporate Controller. He holds a B.A. in Applied Mathematics and Economics from Harvard University.
ROBERT CAMPBELL, M.SC., P. GEO – VICE PRESIDENT, EXPLORATION AND DIRECTOR | Mr. Campbell is an exploration geologist with over 40
years experience in mining and exploration in Canada, the United States and Latin America. He most recently served as Vice President, Exploration for Largo Resources Ltd., a company he was involved with since its inception in 2003. Mr. Campbell has also worked with a number of major mining companies, most notably Noranda and Lac Minerals, and has held other senior management positions such as Vice President of Exploration for Apogee Minerals Ltd.
MARIA VIRGINIA ANZOLA - GENERAL COUNSEL & CORPORATE SECRETARY | Ms. Anzola has over 20 years of experience in the extraction industry.
Prior to Ascendant, Ms. Anzola served as Assistant General Counsel for Primero Mining Corp, and as Senior Counsel for Hudbay Minerals Inc. Ms. Anzola also previously served as Consultant to the Tax Group of Borden Ladner Gervais LLP for over two years. Prior to moving to Canada, Ms. Anzola spent 11 years in private practice in her home country of Venezuela, mostly advising international companies engaged in the oil and gas business. Ms. Anzola has been called to the BAR in Ontario and Venezuela and has an LL.M from the University of Michigan and from Osgoode Hall Law School.
33 33
w w w . a s c e n d a n t r e s o u r c e s . c o m
T S X : A S N D
A diverse and experienced Board
MARK BRENNAN
EXECUTIVE CHAIRMAN | Mr. Brennan is a founding partner of Ascendant Resources Inc. and has over 30 years of financing and
in the regenerative growth of the Company between 2015 -2017. Prior to Sierra Metals, Mr. Brennan served as President & CEO at Largo Resources Ltd., a billion dollar plus company which is a global leader in the production of vanadium. He was a founding member of Desert Sun Resources, sold to Yamana in 2007 for $700 million and the Co-Founder of Brasoil do Brasil Exploracao Petrolifera S.A., a private oil and gas producing Corporation in Brazil. He currently serves as a founder and Chairman of Cerrado Gold and a founding director of James Bay Resources Limited. In addition, he has been President of Linear Capital Corporation, a private merchant bank, since February 1998.
CHRIS BUNCIC, MBA, CFA, P. Eng
PRESIDENT, CEO, AND DIRECTOR
PETRA DECHER, CPA DIRECTOR | Ms. Decher currently serves as Chairwoman of the Board at Red Pine Exploration Inc. and recently served as the Lead
Independent Director of Integra Gold Corp. until its acquisition by Eldorado Gold Corporation. Ms. Decher served as the VP, Finance and Assistant Secretary for Franco-Nevada Corporation from 2009 to 2016. Prior to Franco-Nevada, Ms. Decher was President and Chief Financial Officer for Geoinformatics Exploration Inc., an exploration company focused on projects in British Columbia, Nevada, Mexico and Australia. Ms. Decher is a Chartered Public Accountant.
GUILLERMO KAELIN DIRECTOR | Mr. Kaelin is a capital markets professional with over 18 years of experience in private equity, investment banking,
research and public securities and is currently the Head of Latin America of Appian Capital Advisory LLP. Previously, Mr. Kaelin served as a Managing Director with Arias Resource Capital Management LP, a mining focused Private Equity Fund which he joined in 2008. Mr. Kaelin has an MBA from the University of Chicago, an MS in Finance from ESAN (Peru) and a BS in Industrial Engineering from the Universidad de Lima.
KURT MENCHEN DIRECTOR | Mr. Menchen has over 37 years of experience operating and managing mining projects, including over 20 years as General
Manager at the Jacobina Gold project in Brazil where he successfully operated the underground project for Anglo American, Desert Sun Mining and eventually Yamana Gold.
STEPHEN SHEFSKY LEAD DIRECTOR | Mr. Shefsky is the President & CEO, Founder and Director of James Bay Resources Ltd. and has over 40 years’
experience in the investment and mining industry through Canada and Latin America. Mr. Shefsky is the co-founder of Brasoil do Brasil Exploracao Petrolifera S.A., a private oil and gas producing and exploration corporation operating in Brazil since 2006. Mr. Shefsky is also the President and Chief Executive Officer
Shefsky was also a director and the Executive Chairman of Castle Resources Inc. from February 2008 and July 2011.
ROBERT CAMPBELL, M.SC., P. GEO
VP EXPLORATION AND DIRECTOR
34 34
w w w . a s c e n d a n t r e s o u r c e s . c o m
T S X : A S N D
Key Option Terms
million in cash ($400,000 on closing of the transaction and $400,000 on July 15, 2018) and $1.65 million in Ascendant shares, representing an approximate share dilution of 2.6% on a basic basis and 2.1% on a fully diluted basis.
closing date, to fund exploration drilling, metallurgical test work, economic studies and other customary activities for exploration and development, and
▪ 6 months after the closing date: $0.25 million ▪ 12 months after the closing date: $0.25 million ▪ 18 months after the closing date: $0.5 million ▪ 24 months after the closing date: $0.5 million ▪ 36 months after the closing date: $ 1.0 million ▪ 48 months after the closing date: $ 1.0 million
subsidiary, by completing a Feasibility study within 54 months and making a further payment of $2.5 million to Crestgate.
investment through cash flow until repaid.
(all amounts USD)
35 35
w w w . a s c e n d a n t r e s o u r c e s . c o m
T S X : A S N D
Timeline Since Discovery
Discovery Instituto Geologico e Mineiro (IGM), 17 holes totalling 7,588 m. Hole LS-04, 76.9 m of massive sulphide Rio Tinto Zinc and ED Airborne magnetic survey, geophysical surveys, soil sampling 20 holes totalling 10,404 m. Metallurgical test work
Redcorp Ventures Acquired the property 22 holes totalling 11,220 m. Resource estimate (2007)
Portex Minerals Acquired Redcorp, 7 holes totalling 1,612 m. Resource estimate (2012)
Mineral & Financial Investments Acquired Redcorp, 10 holes totalling 3,464 m. Resource estimate Jan. 2018.
Ascendant Resources Acquired interest in project through an interest in Redcorp (operating entity) 46 holes, totalling 15,241m Resource estimate Feb 2019 Updated Resource in Sept 2019
36 36
w w w . a s c e n d a n t r e s o u r c e s . c o m
T S X : A S N D
Representative of the Lagoa Salgada Mineralization
Source: Volcanogenic Massive Sulphide Deposits, Alan G. Galley, Mark D. Hannington, And Ian R. Jonasson, 2007.
37 37
w w w . a s c e n d a n t r e s o u r c e s . c o m
T S X : A S N D
El Mochito Mine COMMUNITY WORKFORCE ENVIRONMENT
Through various community investments, El Mochito has contributed to local employment generation, infrastructure improvement and education advancement. El Mochito strives to play an active role in the strengthening of the surrounding community and will continue to remain a steward of responsibility going forward. El Mochito’s multiple environmental sustainability programs seek to preserve the region's natural resources and monitor the quality of soil, water, air and the protection of local wildlife. Through various initiatives, we continue to make environmental protection a core pillar in our day-to-day operations. We believe our workforce and their well being are imperative to the success and sustainability of the El Mochito operation. The continuous commitment to our workforce is reaffirmed through the development of our employees in the areas of workplace and educational advancement and a strong commitment to the improvement of ongoing health and safety initiatives. Ascendant Resources continues to make mining responsibly at El Mochito its top priority as it creates tangible benefits for all our stakeholders, including our employees, the local communities and the environment in which we operate in.
Consecutive Annual Award Received for Corporate Social Responsibility
38 38
w w w . a s c e n d a n t r e s o u r c e s . c o m
T S X : A S N D
Significant Improvements Made Since Acquisition
Safety Achievement Milestones: 1 million Lost Time Injury-Free Hours 1 million Fatality-Free Shifts Continued improvements of safety performance Increased focus on minor incidents A true Paradigm shift in safety culture
1 2 3 4 5 6 7
1.00 1.50 2.00 2.50 3.00
Cases LTIF Rate Axis Title
Lost Time Restricted Work Medical Treatment First Aid LTIF
39 39
w w w . a s c e n d a n t r e s o u r c e s . c o m
T S X : A S N D
Continually Build and Foster a Safety-First Culture
40 40
w w w . a s c e n d a n t r e s o u r c e s . c o m
T S X : A S N D
38,521 38,866 53,729 49,393 50,597 50,795 57,458 58,978 59,601 64,449 64,327 69,578
30,000 35,000 40,000 45,000 50,000 55,000 60,000 65,000 70,000 Jan Feb Mar Apr May Jun Jul Aug Sept Oct Nov Dec
81% Production Increase in 2017
Positive EBITDA Free Cash Flow Positive
El Mochito Transformed to a Free Cash Flowing Operation: Annual Production Exceeded 2017 Production Target.
Tonnes Milled
DIRECT OPERATING COSTS
Note: All % figures are provided on a full 2017 calendar year basis from Jan 2017-Dec 2017.
TRUCK AVAILABILITY PRODUCTIVE WORKING HOURS
IMPROVED VENTILATION VOLUMES
41 41
w w w . a s c e n d a n t r e s o u r c e s . c o m
T S X : A S N D
El Mochito Back on Track
for sustained annualized production of +90 MM lbs.
previous operators impacted 2016 operating results
90
2014 2015 2016 2017 2018 2019 Tonnes Milled 756.0 765.9 515.6 656.3 756.0 775.6 Average Head Grades Zinc 4.6% 3.4% 3.4% 3.5% 4.3% 4.4% Lead 2.6% 1.7% 1.2% 1.4% 1.7% 2.0% Silver 86g/t 50g/t 46g/t 43g/t 54g/t 70g/t ZnEq 9.5% 6.3% 5.8% 5.6% 6.5% 7.4% Average Recoveries Zinc 85.6% 87.2% 90.7% 88.9% 87.7% 85.2% Lead 78.7% 75.9% 73.3% 74.3% 78.1% 80.4% Silver 87.4% 88.3% 80.5% 77.7% 78.0% 81.2% Contained Metal Production Zinc (ktonnes) 29.5 23.0 15.9 20.4 28.4 29.2 Lead (ktonnes) 15.5 9.8 4.4 6.8 9.9 12.3 Silver (Kozs) 1,827.0 1,105.0 614.3 698.5 1,001.5 1,401.1 ZnEq (MMlbs) 133.5 90.5 54.8 66.1 91.4 106.2
60.6 41 24.8 29.9 41.5 48.2
200 400 600 800 1000 1200 1400 1600 1800 2000 10 20 30 40 50 60 70 2014 2015 2016 2017 2018 2019
Silver 000’s ozs Contained Metal Production Zinc (ktonnes) Lead (ktonnes) ZnEq (ktonnes) Silver (Kozs)
42 42
w w w . a s c e n d a n t r e s o u r c e s . c o m
T S X : A S N D
2019 YTD Actual Mining Operations
Breast
Conventional Zone Production
Trackless Zone Production
43 43
w w w . a s c e n d a n t r e s o u r c e s . c o m
T S X : A S N D
Current Mine Processing at El Mochito
44 44
w w w . a s c e n d a n t r e s o u r c e s . c o m
T S X : A S N D
Representative of the El Mochito Carbonate Replacement Skarn Mineralization
45 45
w w w . a s c e n d a n t r e s o u r c e s . c o m
T S X : A S N D
Zinc Fundamentals Remain Strong as Supply Continues to Drive Tightening Market
Source: Bloomberg, LME
Physical zinc market remains very tight
Fundamentals continue to indicate structural deficits due to lack of new supply. Supply deficits drove prices to 10-year highs of $1.63/lb in Jan. 2018. Although current prices have edged down due to new supply expectations and trade war rhetoric, analysts forecast continued tightness in the physical market and ramp up delays among new operations.
Global zinc demand remains steady.
Modest global GDP growth of 2-3% implies strengthening demand (~400kt pa of additional new supply required).
Zinc price forecasts remain strong.
Analysts’ average annual zinc price forecasts: 2020E: US$1.20/lb
Recent Pullback Appears Unwarranted.
Uncertainty regarding potential global trade wars and political rhetoric has resulted a material pullback in prices over the past few months, however, underlying fundamentals have not changed, supporting a recovery in prices.
46 46
w w w . a s c e n d a n t r e s o u r c e s . c o m
T S X : A S N D
Zinc is the 30th element in the periodic table of elements.
in the world after iron, aluminum and copper.
The most common and commercial use for zinc is galvanizing (rust-proofing) steel accounting for
Zinc
30
13.7 millions tonnes consumed globally in 2018.
75% sourced
from mining.
25% sourced
from recycling. Fertilizer accounts for
47 47
w w w . a s c e n d a n t r e s o u r c e s . c o m
T S X : A S N D
110 Yonge Street, Suite 501 Toronto, Ontario M5C 1T4 www.ascendantresources.com Tel: 647-796-0066 Fax: 647-796-0067
Investor Contact: Katherine Pryde, MBA, CPA, CMA Director, Communications and Investor Relations info@ascendantresources.com