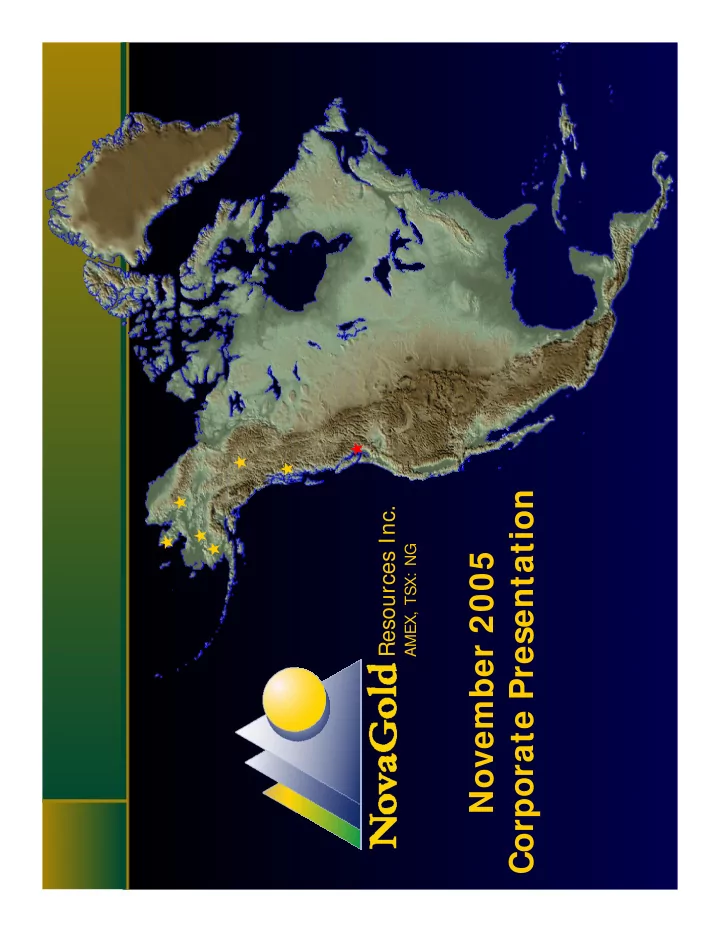
SLIDE 1 Resources Inc.
AMEX, TSX: NG
November 2005 Corporate Presentation
SLIDE 2 Forward Forward-
Looking Statements
This presentation includes certain This presentation includes certain “ “Forward Forward-
Looking Statements” ” within the meaning of section 21E of the United States Securitie within the meaning of section 21E of the United States Securities s Exchange Act of 1934, as amended. All statements, other than Exchange Act of 1934, as amended. All statements, other than statements of historical fact, included herein, including withou statements of historical fact, included herein, including without t limitation, statements regarding potential mineralization and limitation, statements regarding potential mineralization and resources, exploration results and future plans and objectives o resources, exploration results and future plans and objectives of f NovaGold Resources Inc., are forward NovaGold Resources Inc., are forward-
looking statements that involve various risks and uncertainties. There can be no involve various risks and uncertainties. There can be no assurance that such statements will prove to be accurate and assurance that such statements will prove to be accurate and actual results and future events could differ materially from actual results and future events could differ materially from those anticipated in such statements. Important factors that those anticipated in such statements. Important factors that could cause actual results to differ materially from NovaGold could cause actual results to differ materially from NovaGold expectations are disclosed under the heading expectations are disclosed under the heading “ “Risk Factors Risk Factors” ” and and elsewhere in NovaGold documents filed from time to time with elsewhere in NovaGold documents filed from time to time with the Toronto Stock Exchange, The United States Securities and the Toronto Stock Exchange, The United States Securities and Exchange Commission and other regulatory authorities. Exchange Commission and other regulatory authorities.
SLIDE 3 NovaGold: The Growth Opportunity in Gold & Copper NovaGold: The Growth Opportunity in Gold & Copper
- Motivated and Entrepreneurial Management Team with Decades of
Motivated and Entrepreneurial Management Team with Decades of Experience with the Major Mining Companies in Exploration, Opera Experience with the Major Mining Companies in Exploration, Operations tions and Finance and Finance
- Demonstrated Consistent Market Value Growth Over Past 5+ Years
Demonstrated Consistent Market Value Growth Over Past 5+ Years Through Strategic Acquisition and Successful Exploration of High Through Strategic Acquisition and Successful Exploration of High-
Potential, Undervalued Mineral Assets Undervalued Mineral Assets
- Systematic Expansion of High
Systematic Expansion of High-
Quality, Mid-
- Tier Producer Level Resource
Tier Producer Level Resource (Net Inventory to NovaGold After All Earn (Net Inventory to NovaGold After All Earn-
Ins): 25.1 Million 25.1 Million Ozs Ozs Gold and 181.5 Million Gold and 181.5 Million Ozs Ozs Silver Silver 13.4 Billion Lbs Copper and 2.2 Billion Lbs Zinc 13.4 Billion Lbs Copper and 2.2 Billion Lbs Zinc
- Continued Future Growth Through Advancement of Existing Portfoli
Continued Future Growth Through Advancement of Existing Portfolio of
Four North American Projects Through Development to Production Four North American Projects Through Development to Production
- Rapid Production Growth Profile Starting at 100,000
Rapid Production Growth Profile Starting at 100,000 Ozs Ozs/Year in 2006 /Year in 2006-
07 Increasing to > 700,000 Increasing to > 700,000 Ozs Ozs Gold, 2 Million Gold, 2 Million Ozs Ozs Silver and 300 Million Lbs Silver and 300 Million Lbs Copper Annually by 2010 Copper Annually by 2010-
- 11 at Lower Quartile Production Cost
11 at Lower Quartile Production Cost
- Exploration Upside Through Major Controlling Land Position of ov
Exploration Upside Through Major Controlling Land Position of over 700 er 700 Square Kilometers within Low Risk Political Jurisdictions of Ala Square Kilometers within Low Risk Political Jurisdictions of Alaska and ska and Western Canada Western Canada
- Annual Cash Flow From Nome Operations
Annual Cash Flow From Nome Operations
SLIDE 4
NovaGold Management Team NovaGold Management Team
Rick Van Nieuwenhuyse
President & CEO
Greg Johnson
Vice President Corporate Communications & Strategic Development
Joe Piekenbrock
Vice President Exploration
Doug Nicholson
VP/General Manager Alaska Gold Nome Operations
Kevin Francis
Resource Estimation Manager
Sue Craig
Environmental and Land Manager
Peter Harris
Senior Vice President & COO
Don MacDonald
Senior Vice President & CFO
Doug Brown
Vice President Business Development
Carl Gagnier
EVP NovaGold Canada General Manager Galore Creek Project
Dean Lindsay
Senior Projects Engineer Galore Creek Project Alberto Chang Chief Mining Engineer Galore Creek Project
SLIDE 5
NovaGold (AMEX,TSX: NG) NovaGold (AMEX,TSX: NG) Shares (millions)
Issued & Outstanding 72.9 Fully Diluted 87.3
Shareholders
Ownership
Institutional Investors 40% Management/Directors 5% Market Capitalization US$615 M (C$725 M) Cash (Sept 2005) US$60 M (C$72 M) In-the-Money Warrants/Options US$53 M (C$62 M)
Component of S&P TSX 300 Index, S&P TSX Ethical Canadian Index, AMEX Gold Index (GDM) and S&P Toronto Gold Index (XGD)
SLIDE 6 A Pipeline of Advanced Stage A Pipeline of Advanced Stage North American Gold & Copper Projects North American Gold & Copper Projects
Advancing Four of the Largest Undeveloped Deposits Advancing Four of the Largest Undeveloped Deposits in North America: in North America:
– – Donlin Creek, Alaska Donlin Creek, Alaska (25.4 (25.4 MOzs MOzs Gold) Gold)
70% -
- 30% joint venture with Placer Dome
30% joint venture with Placer Dome
Native American Partner – – Calista Corporation Calista Corporation – – Galore Creek, BC Galore Creek, BC (13.7 (13.7 MOzs MOzs Gold, 156 Gold, 156 MOzs MOzs Silver, 12.0 B Lbs Copper) Silver, 12.0 B Lbs Copper)
- Contained Metal Equivalent to a 40 Million Ounce Gold Deposit
Contained Metal Equivalent to a 40 Million Ounce Gold Deposit
- Option Agreement for 100% Ownership
Option Agreement for 100% Ownership
First Nations Partner – – Tahltan Nation Development Corporation Tahltan Nation Development Corporation – – Nome Operations, Alaska (Rock Creek & Nome Gold) Nome Operations, Alaska (Rock Creek & Nome Gold) (3.3 (3.3 MOzs MOzs Gold) Gold)
100% Ownership
Native American Partner – – Bering Straits Native Corporation Bering Straits Native Corporation – – Ambler Project, Alaska Ambler Project, Alaska (0.8 (0.8 MOzs MOzs Gold, 64 Gold, 64 MOzs MOzs Silver, and 3.2 B Lbs Copper, 4.4 B Lbs Zinc Silver, and 3.2 B Lbs Copper, 4.4 B Lbs Zinc) )
- Contained Metal Equivalent to a 16 Million Ounce Gold Deposit
Contained Metal Equivalent to a 16 Million Ounce Gold Deposit
51% -
- 49% joint venture with Rio Tinto
49% joint venture with Rio Tinto
Native American Partner – – Nana Regional Corporation Nana Regional Corporation
SLIDE 7 Long Term Commodity Cycles Long Term Commodity Cycles
Lowest Real Prices for Metals in a Century
SLIDE 8 Industrialization Build Industrialization Build-
Copper Intensity of Use by Major Economy Copper Intensity of Use by Major Economy
Source: JP Morgan & CRU
10 20 30 40 50 60 70
1 9 5 1 9 5 3 1 9 5 6 1 9 5 9 1 9 6 2 1 9 6 5 1 9 6 8 1 9 7 1 1 9 7 4 1 9 7 7 1 9 8 1 9 8 3 1 9 8 6 1 9 8 9 1 9 9 2 1 9 9 5 1 9 9 8 2 1 Copper lbs Per Capita Taiwan South Korea Japan China USA Germany 11% Growth Rate
SLIDE 9 20 25 30 35 40 45 50 55 1 9 8 1 9 8 1 1 9 8 2 1 9 8 3 1 9 8 4 1 9 8 5 1 9 8 6 1 9 8 7 1 9 8 8 1 9 8 9 1 9 9 1 9 9 1 1 9 9 2 1 9 9 3 1 9 9 4 1 9 9 5 1 9 9 6 1 9 9 7 1 9 9 8 1 9 9 9 2 2 1 Y ears of R eserves 0.50 0.55 0.60 0.65 0.70 0.75 0.80 0.85 0.90 0.95 1.00 % C
rade Y ears C u P roduction R eserv es A v erage C u O re G rade
Source: Phelps Dodge Source: Phelps Dodge
Exploration Discoveries Not Keeping Pace with Accelerating Consumption
Potential for Severe Supply Constraints
Declining Industry Declining Industry-
Wide Copper Reserves and Quality Since 1980 and Quality Since 1980
SLIDE 10 Global Copper Deposit Discoveries 1950-2000
1950 1955 1960 1965 1970 1975 1980 1985 1990 1995 12 10 8 6 4 2 2.40 1.8 1.2 0.6 Inflation Adjusted CRB Index 1970 = 1 Number of Discoveries Per Year
1960 – 1970: Peak Period of Discoveries
Source: JP Morgan & CRU
SLIDE 11
Total Inventory After All Earn-Ins for Advanced Development Stage Projects
Measured and Indicated Resources shown as Base of Column Inferred Resources shown as Amount above Marked Line (Includes Only 30% of Donlin Creek Resource) 2 4 6 8 10 12 14 16 18 20 22 24 26 1998 1999 2000 2001 2002 2003 2004 2005 Pounds Copper (Billions) Pounds Zinc (Billions) 12.0 10.0 8.0 6.0 4.0 1.0 Ounces of Gold (Millions) Ounces of Sliver (10x Millions) $25 Billion In-Situ Value at $375/oz Gold and $0.90/lb Copper 11.0 9.0 7.0 5.0 3.0 2.0
NovaGold NovaGold’ ’s Net Resource Growth s Net Resource Growth
SLIDE 12 $0 $10 $20 $30 $40 $50 $60 $70 $80 $90 $100
Res Definition Pre-Feasibility Feasibility Production
Typical Market Valuation Range Of A Gold Company At the Feasibility Development Stage
Discovery
($100-$250/oz) ($50-$75/oz) ($20-$35/oz) ($5-$10/oz)
Precious Metals Sector Valuation Metrics: Enterprise Value Per Ounce of Gold Resource Inventory At Various Development Stages Through To Production
Current Producer Valuation Range
NovaGold
(Gold Only) (Gold+Silver+Copper)
X
2-5 yrs 1-3 yrs 1-2 yrs 1-2 yrs
Decreasing Risk Increasing Valuation
X X
$10/Sh
SLIDE 13 Addition of New Undervalued Assets to Company Portfolio Advancement of Project Resources To Next Phase of Development Toward Production Rising Metals Prices Which Increase Metal Inventory Value
NovaGold’s 5-Year Performance
2001 2002 2003 2004 2005
NovaGold Share Price C$ Gold and Copper Price US$ Copper and Zinc I nventory (Billions Lbs) Gold and Silver I nventory (Millions Ozs)
Enterprise Value Per Oz $30 $15 $5
NovaGold US$EV/ Oz
Donlin Galore
Resource Inventory Growth Through Exploration Success
Fundamental Drivers of Resource Company Fundamental Drivers of Resource Company Share Price Performance: Share Price Performance:
Growth in Metal Production
SLIDE 14 100 200 300 400 500 600 700 800 900 1,000 2007 2008 2009 2010 2011/12
G alore C reek (C
q) G alore C reek (G
Donlin C reek (w/ P lacer Dome) Nome E xpansion (Nome G
Nome Operations (R
reek)
NovaGold’s Projected Production Growth NovaGold’s Projected Production Growth
NovaGold’s Net Share of Annual Production Mid Range estimates in 000’s of Ounces (Net After All Earn-Ins)
Annual Gold Production Targets
Cu Cu Annual Share of Production 000’s of Ounces
SLIDE 15 Future Annual Production Estimates Future Annual Production Estimates
Using $400/oz Gold, $6/oz Silver and $1.00/lb Copper Using $400/oz Gold, $6/oz Silver and $1.00/lb Copper
+ 2008
32.7 0.4 Ambler (51% ) 2007 $600M (AMEC) $150 to $200/ oz 350,000 to 500,000
Donlin Creek (30% )
$50/ Oz2 with Copper Credits
(Hatch) $15M $55M Capital Costs 700,000 to 1,000,000 Ozs/ Year
350,000 50,000 100,000 Annual Gold Production (Ozs net) $175/ oz1 $0.57/ lb
$0.57/ lb (-300/ oz) 2 $250 to $275/ oz $250 to $275/ oz Total Cash Costs per Oz & Lb 13.4
Copper (B Lbs) 181.5
Silver (M oz) 25.1 0.5 13.2 2.3 1.1 Net Gold (M oz) 2007 Galore Creek 2006-07 Nome Expansion (Nome Gold) Total Total (Weighted Average) (Weighted Average) Production Decision * * Property Property Shotgun (50% ) Mid-2006 Nome Operations (Rock Creek) Production Decision: Feasibility Study Completed, Permitted and Ready to Construct Total Cash Costs: 1) Gold and Copper Co-Product 2) Gold with Copper Credit Using Gold Institute Methodology
SLIDE 16
- Historic Production: 45 Moz
- Current Resources: 75 Moz
- Total Ounces of Gold: 120 Moz
Seward Peninsula Gold Province Seward Peninsula Gold Province Kuskokwim Gold Belt Kuskokwim Gold Belt Tintina Gold Belt Tintina Gold Belt Stikine Gold Belt Stikine Gold Belt NW Alaska Polymetallic Belt NW Alaska Polymetallic Belt
Alaska and Western Canada Projects Alaska and Western Canada Projects
SLIDE 17
Seward Peninsula Gold Province Seward Peninsula Gold Province
Rock Creek, Big Hurrah and Nome Gold 100% (+ 3 M Ozs Gold) Rock Creek, Big Hurrah and Nome Gold 100% (+ 3 M Ozs Gold)
Nome Operations Nome Operations
SLIDE 18
Aerial View of Nome, Alaska Aerial View of Nome, Alaska
Rock Creek Deposits Nome Gold Deposits
SLIDE 19 NovaGold Lands in Nome, Alaska NovaGold Lands in Nome, Alaska
2 Miles 5 Kilometers
NovaGold Owned Lands
Leased Bering Straits Native Corporation Lands
Rock Creek Deposit Saddle Deposit Nome Gold Deposits
Sand & Gravel Operations
Port and City of Nome Big Hurrah Deposit
SLIDE 20 Rock Creek Project Rock Creek Project – – Nome, Alaska Nome, Alaska
- Feasibility Study Underway
Feasibility Study Underway
- Permit Process Initiated with State of Alaska
Permit Process Initiated with State of Alaska
- Resource: 1 Million Ounces
Resource: 1 Million Ounces
- Production of > 100,000 Oz Gold/Year Starting Late 2006
Production of > 100,000 Oz Gold/Year Starting Late 2006
- Construction anticipated to begin by mid
Construction anticipated to begin by mid-
2006: – – State maintained road access, surplus power available State maintained road access, surplus power available – – Open pit mining, mineralization starts at surface Open pit mining, mineralization starts at surface – – Free milling gold (80% gravity, 96% with flotation) Free milling gold (80% gravity, 96% with flotation) – – Total Cash Costs: $250 Total Cash Costs: $250-
$275/oz – – Capital Cost: US$55 Million Capital Cost: US$55 Million – – $15 Million to $20 Million Net Cash Flow $15 Million to $20 Million Net Cash Flow
- District Exploration Upside
District Exploration Upside – – Big Hurrah, Saddle etc. Big Hurrah, Saddle etc.
SLIDE 21
Rock Creek Deposit Rock Creek Deposit – – Engineering Layout Engineering Layout
SLIDE 22
Rock Creek Deposit 3D Mine Model Rock Creek Deposit 3D Mine Model
SLIDE 23
Rock Creek Rock Creek – – Grade Control Test Mining Grade Control Test Mining
SLIDE 24
Rock Creek Mine Equipment Rock Creek Mine Equipment Bound for Nome, Alaska Bound for Nome, Alaska – – September 2005 September 2005
SLIDE 25
Rock Creek Mine Equipment Rock Creek Mine Equipment Landing in Nome, Alaska October 2005 Landing in Nome, Alaska October 2005
SLIDE 26
Road Accessible Exploration Potential Road Accessible Exploration Potential Nome Mining District, Alaska Nome Mining District, Alaska
SLIDE 27
Exploration Potential Around Rock Creek Deposit Exploration Potential Around Rock Creek Deposit Nome Mining District, Alaska Nome Mining District, Alaska
SLIDE 28
Kuskokwim Gold Belt Kuskokwim Gold Belt
25 M Oz Donlin Creek Project 25 M Oz Donlin Creek Project
NovaGold (70% ) - Placer Dome (30% ) Joint Venture NovaGold (70% ) - Placer Dome (30% ) Joint Venture
SLIDE 29 Donlin Creek Project Donlin Creek Project -
Location Map
map area
5 Miles 5 Kilometers
25 Million Ounce Resource Area
Leased Calista Native Corporation Lands
108 Square Kilometers 42 Square Miles
Crooked Creek Community Kuskokwim River Barge Facility
SLIDE 30 25 Million Ounce Resource Area
Donlin Creek Project Donlin Creek Project -
View Looking North
25 Million Ounce Resource Area Acma Deposit Lewis Deposit
SLIDE 31 Donlin Creek Project Donlin Creek Project
- Largest Undeveloped Gold Deposit in North America:
Largest Undeveloped Gold Deposit in North America: – – 25.4 Million Ounces Gold Grading + 3 g/t ($325 gold) 25.4 Million Ounces Gold Grading + 3 g/t ($325 gold) – – Sulfide Ore with + 90% Recovery Using Pressure Oxidation Sulfide Ore with + 90% Recovery Using Pressure Oxidation
- Placer Dome has right to earn additional 40% Interest in Project
Placer Dome has right to earn additional 40% Interest in Project – – By spending next US$32 million toward development By spending next US$32 million toward development – – Complete Bankable Feasibility Study and Permits Complete Bankable Feasibility Study and Permits – – Make Board Level Construction Decision by November 2007 Make Board Level Construction Decision by November 2007
2005 Program -
- Placer Dome to Complete + 25,000 meters In
Placer Dome to Complete + 25,000 meters In-
Fill Drilling, Pre Drilling, Pre-
- Feasibility Study and Initiate Permitting
Feasibility Study and Initiate Permitting US$13 Million Budget (No Contribution Required from NovaGold) US$13 Million Budget (No Contribution Required from NovaGold)
- Annual Gold Production Rate > 1.1 to 1.5 Million
Annual Gold Production Rate > 1.1 to 1.5 Million Ozs Ozs/Year /Year at Total Cash Cost of $150 at Total Cash Cost of $150-
200 per Ounce of Gold
- Deposit Open to Expansion
Deposit Open to Expansion – – Only 2 kilometers of 10 kilometer mineralized trend Only 2 kilometers of 10 kilometer mineralized trend – – Resource modeled only to 300 meters depth Resource modeled only to 300 meters depth
- Strong Federal, State and Local Support for Project
Strong Federal, State and Local Support for Project NovaGold (70% ) - Placer Dome (30% ) Joint Venture NovaGold (70% ) - Placer Dome (30% ) Joint Venture
SLIDE 32
Donlin Creek Deposit 3D Mine Model Donlin Creek Deposit 3D Mine Model
SLIDE 33
NW Alaska Polymetallic Belt NW Alaska Polymetallic Belt
Ambler Ambler Polymetallic Polymetallic Project, Alaska Project, Alaska
NovaGold (51% ) Rio Tinto (49% ) NovaGold (51% ) Rio Tinto (49% )
SLIDE 34 Ambler Project, Alaska Ambler Project, Alaska
- 51% Option from Rio Tinto March, 2004
51% Option from Rio Tinto March, 2004
- NovaGold to match Rio Tinto US$20 million expenditures
NovaGold to match Rio Tinto US$20 million expenditures (US$5 million in first 5 years) (US$5 million in first 5 years)
- Conclude Agreements for Access and Infrastructure
Conclude Agreements for Access and Infrastructure
Complete Positive Pre-
Feasibility Study
- At Positive Feasibility Rio Tinto may buy back 2% to become
At Positive Feasibility Rio Tinto may buy back 2% to become Manager and Construct/Operate the Mine Manager and Construct/Operate the Mine
- Project Resource 36.3 Million Tonnes (Arctic Deposit)
Project Resource 36.3 Million Tonnes (Arctic Deposit) 0.82 0.82 M M ozs
0.7 g/t 0.7 g/t Gold Gold 0.8% 0.8% 5.5% 5.5% 4.0% 4.0% 55 g/t 55 g/t Grade Grade 64.1 64.1 M M ozs
Silver Silver 0.6 0.6 B lbs B lbs 4.4 4.4 B lbs B lbs 3.2 3.2 B lbs B lbs Contained Contained Metal Metal Lead Lead Zinc Zinc Copper Copper
Contained Metal Value Equivalent to a 16 Million Ounce Gold Depo Contained Metal Value Equivalent to a 16 Million Ounce Gold Deposit sit
SLIDE 35
Ambler Project Ambler Project
View of Arctic Deposit View of Arctic Deposit
SLIDE 36 Ambler Project Alaska Arctic Deposit Geology
Ambler Project, Arctic Deposit Geologic Cross Section Ambler Project, Arctic Deposit Geologic Cross Section
SLIDE 37
Arctic Arctic
Sun Sun Shungnak Shungnak Smucker Smucker Sunshine Sunshine
Ambler VMS District Regional Geology Ambler VMS District Regional Geology
NovaGold - Rio Tinto Joint Venture
SLIDE 38
Stikine Gold Belt Stikine Gold Belt
Galore Creek Project Galore Creek Project – – NovaGold (100% ) NovaGold (100% )
13.75 Moz Gold, 156 Moz Silver, 12.0 B Lbs Copper 13.75 Moz Gold, 156 Moz Silver, 12.0 B Lbs Copper
SLIDE 39 Galore Creek Project and Road Access Corridors Designated For Mineral Development in Stikine- Cassiar Land Resource Management Plan (LRMP) Approved in 2000 Surplus Shipping Capacity at Stewart, BC Port Facility Strong BC Government, local community and Tahltan First Nation Support for Project Located in northwestern British Columbia West of Cassiar Highway
Galore Creek Project Location Map Galore Creek Project Location Map
Juneau Wrangell Stewart DeaseLake
Galore Creek Galore Creek Eskay Eskay Creek Creek
SLIDE 40
Galore Creek Exploration Camp Junction Zone Southwest Deposit West Fork Zone Copper Canyon Central Deposit
1 kilometer
Galore Creek Project Overview Photo Galore Creek Project Overview Photo
Middle Creek
SLIDE 41
Galore Creek Deposit 3D Mine Model Galore Creek Deposit 3D Mine Model
SLIDE 42 Galore Creek Galore Creek -
Project Parameters
October 2005 Pre-
- Feasibility Study Based on Resource Estimate
Feasibility Study Based on Resource Estimate
Ozs Gold, 156.4 M Gold, 156.4 M Ozs Ozs Silver & 12.0 B lbs Copper Silver & 12.0 B lbs Copper
- 65,000 tpd, Open Pit Mine with Low 2.2:1 Strip Ratio
65,000 tpd, Open Pit Mine with Low 2.2:1 Strip Ratio
- Initial 6 years Production (1.2% Copper
Initial 6 years Production (1.2% Copper Eq Eq or 2.0
g/t Gold Gold Eq Eq): ): – – 300,000 oz Gold, 2.25 M oz Silver, 370 M lbs Copper Annually 300,000 oz Gold, 2.25 M oz Silver, 370 M lbs Copper Annually – – Total Gold and Copper Co Total Gold and Copper Co-
Product Cash Costs:
- $140/oz for Gold and $0.57/lb Copper
$140/oz for Gold and $0.57/lb Copper – – Total Cash Costs (Gold Institute Methodology): Total Cash Costs (Gold Institute Methodology):
- Minus $300/oz for Gold Net of Copper and Silver Credits
Minus $300/oz for Gold Net of Copper and Silver Credits
- $0.36/lb Copper Net of Precious Metals Credits
$0.36/lb Copper Net of Precious Metals Credits
20-
- year Mine Life Producing 6 Billion lbs Copper with
year Mine Life Producing 6 Billion lbs Copper with 3.7 Million 3.7 Million Ozs Ozs Gold and 40 Million Gold and 40 Million Ozs Ozs Silver Silver
- Recovery: 91% Cu, 71% Au, 62% Ag
Recovery: 91% Cu, 71% Au, 62% Ag
- Deposits Open to Expansion with only 4 of 6 Primary Deposits
Deposits Open to Expansion with only 4 of 6 Primary Deposits included in the Mine Plan included in the Mine Plan
- Opportunities for Enhanced Economics with Expansion of Higher
Opportunities for Enhanced Economics with Expansion of Higher Throughput Years Throughput Years
SLIDE 43 Galore Creek Pre Galore Creek Pre-
Feasibility Study Summary Financial Results at 65,000 Summary Financial Results at 65,000 tonnes tonnes/day /day
$475 million $350 million $215 million $200 million Average Annual Net Cash Flow
Pre-Tax – Years 1-6 After-tax – Years 1-6
30.3% 23.5% 11.1% 8.1% Project I nternal Rate of Return (I RR)
Pre-Tax After-Tax
2.1 years 5.2 years After-tax Payback (US$1.1 B Capital) $3,146 million $ 1,495 million $ 783 million $ 191 million After-tax Net Present Value (NPV)
@ 0% @ 5%
Recent Market Conditions (2) Long-Term Avg Prices (1) First Six Years of Production
Grading 1.2% Copper Eq or 2 g/ t Gold Eq
1) Long term average metal prices $1.00/lb copper, $400/oz gold, $6.00/oz silver 2) Recent metal prices $1.75/lb copper, $450/oz gold, $7.00/oz silver
SLIDE 44 Galore Creek Schematic Cross Section Galore Creek Schematic Cross Section
Looking North
100% Pit 50% Pit
Central Deposit
Butte Prospect New Extension
1300m 1100m 900m 700m
V1 V2 V3 V1 V2 I9 V1
Breccia Zones
Bountiful Deposit
Southwest & Middle Creek Deposits
Intrusive complex Intrusive complex
New Extension of Mineralization 187 m @ 3.2% CuEq
500 meters
V2 Host Volcanic Rocks
SLIDE 45 Galore Creek Galore Creek -
- Project Milestone Timeline
Project Milestone Timeline
- Resource Updates Completed
Resource Updates Completed April 2005 April 2005
Pre-
Feasibility Study 65,000 tpd tpd Oct 2005 Oct 2005
- Feasibility Drill Program 60,000 m
Feasibility Drill Program 60,000 m Nov 2005 Nov 2005
Submit Permit Documents Q1 2006 Q1 2006
- Feasibility Resource Update
Feasibility Resource Update 1H 2006 1H 2006
Final Feasibility Study 2H 2006 2H 2006
Permit Approvals Mid 2007 Mid 2007
Construction Underway 2007/08 2007/08
Production Start-
up 2010/2011 2010/2011
SLIDE 46 100 200 300 400 500 600 700 800 900 1,000 2007 2008 2009 2010 2011/12
G alore C reek (C
q) G alore C reek (G
Donlin C reek (w/ P lacer Dome) Nome E xpansion (Nome G
Nome Operations (R
reek)
NovaGold’s Projected Production Growth And Average Total Cash Cost Per Ounce NovaGold’s Projected Production Growth And Average Total Cash Cost Per Ounce
NovaGold’s Net Share of Annual Production Mid Range estimates in 000’s of Ounces (Net After All Earn-Ins)
Co Co-
Product Total Cash Cost Profile Total Cash Cost Profile
Annual Gold Production Targets
$225 $225 $200 $200 $175 $175 $150 $150 $125 $125 $100 $100
Total Cash Cost Per Ounce Total Cash Cost Per Ounce
$50 $50
Cu Cu Annual Share of Production 000’s of Ounces
$75 $75 $250 $250 $275 $275
Total Cash Cost Profile Total Cash Cost Profile With Copper Credits With Copper Credits
SLIDE 47 Enterprise Value Per Ounce of Gold Resource Inventory At Various Development Stages Through To Production Enterprise Value Per Ounce of Gold Resource Inventory At Various Development Stages Through To Production
$0 $10 $20 $30 $40 $50 $60 $70 $80 $90 $100
R es Definition P re-F easibility F easibility P roduction
A
arket C ap/
NovaGold
(Gold Only) (Gold+Silver+Copper)
X
Gammon Typical Market Valuation Range Of A Gold Company At Each Development Stage
X
Crystallex Nevsun
X
Discovery
Enterprise Value = US$ Market Cap – Cash + Debt
Decreasing Risk Increasing Valuation
X
Current Producer EV/Oz Range ($100-$250/oz)
2-5 yrs 1-3 yrs 1-2 yrs 1-2 yrs
X X
Francisco Gold (Pre-Takeover) Francisco Gold (at Glamis Takeover)
X
Goldcorp ($250/oz) Glamis ($200/oz) Meridian ($250/oz)
Alamos
X
SLIDE 48 M id-Tier and Junior Producers
$0 $50 $100 $150 $200 $250 $300
M e r i d i a n G
d G l a m i s G
d C e n t e r r a G
d I n t e r m e d i a t e A v g R i
a r c e a C
u r d ' A l e n e N
t h g a t e I a m g
d C
p . A l l P r
u c e r A v g Y a m a n a A g n i c
a g l e I v a n h
A l a m
G
d J u n i
A v e r a g e G u i n
G
d E l d
a d
d H i g h R i v e r G
d N
t h e r n O r i
B e m a G
d G a m m
L a k e C a m b i
H e c l a Q u e e n s t a k e G
d e n S t a r N
a G
d * C r y s t a l l e x
Enterprise Value/O z
Enterprise Value Per Ounce of Gold Resource Inventory
Market Cap – Cash + Debt/ PP Reserve + MII Gold Resource
Enterprise Value Per Ounce of Gold Resource Inventory
Market Cap – Cash + Debt/ PP Reserve + MII Gold Resource
NovaGold
SLIDE 49 New m
B arrick Placer Dom e Kinross G lam is Centerra M eridian G
$285/oz Eldorado A ngico Ivanhoe $100/oz Bem a Coeur Rio Narcea Northgate A lam
Cam bior Nevsun Desert Sun G abriel M inefinders A urizon Crystallex NovaG
$23/oz G am m
M iram ar
1 10 100
$100 $1,000 $10,000 $100,000
Market Capitalization (US$ Millions)
Sen ior Produ cers Mid-Tier Produ cers Ju n ior Produ cers D evelopers
Total Resource Inventory vs. Market Capitalization
with Enterprise Value Per Ounce of Gold Resource (Radius of Circle)
Total Resource Inventory vs. Market Capitalization
with Enterprise Value Per Ounce of Gold Resource (Radius of Circle) Total Resource Inventory
NG at the Average Junior Producer Valuation ($80 Ev/Oz) NG at the Average Mid-Tier Producer Valuation ($160 Ev/Oz)
Millions of Ounces
NG Production Targeted 2007 NG Production Level Targeted for 2010-11
25
$500 $200 $5,000 $2,000
5
$20,000
SLIDE 50 NovaGold: Catalysts for Continued Growth NovaGold: Catalysts for Continued Growth
- Active Advancement of Three World Class Deposits in North Americ
Active Advancement of Three World Class Deposits in North America a – – Galore Creek Galore Creek – – 13.7 M 13.7 M Ozs Ozs Gold, 156 M Gold, 156 M Ozs Ozs Silver, 12.0 B Lbs Copper Silver, 12.0 B Lbs Copper – – Donlin Creek Donlin Creek – – 25.4 M 25.4 M Ozs Ozs Gold Gold – – Ambler Project Ambler Project – – 64 M 64 M Ozs Ozs Silver, 3.2 B Lbs Copper, 4.4 B Lbs Zinc Silver, 3.2 B Lbs Copper, 4.4 B Lbs Zinc – – Nome Operations Nome Operations – – 3 M 3 M Ozs Ozs Gold (Rock Ck, Big Hurrah, Nome Gold) Gold (Rock Ck, Big Hurrah, Nome Gold)
Expanding Mid-
- Tier Producer Level Resource Base (Net After Earn
Tier Producer Level Resource Base (Net After Earn-
Ins) – – 25.1 Million Ounces Gold and 181 Million Ounces Silver 25.1 Million Ounces Gold and 181 Million Ounces Silver – – 13.4 Billion Pounds Copper and 2.2 Billion Pounds Zinc 13.4 Billion Pounds Copper and 2.2 Billion Pounds Zinc
- Rapid Production Growth Profile from Existing Portfolio of Asset
Rapid Production Growth Profile from Existing Portfolio of Assets s – – First Production Targeted for 2006/2007 at 100,000 Ounces/Year First Production Targeted for 2006/2007 at 100,000 Ounces/Year – – 5 5-
- Year Minimum Annual Production Targets:
Year Minimum Annual Production Targets:
+ 700,000 Ounces Gold
2 Million Ounces Silver
- 300 Million Pounds of Copper
300 Million Pounds of Copper – – Total Co Total Co-
- Product Cash Costs $175/Oz Gold and $0.57/lb Copper
Product Cash Costs $175/Oz Gold and $0.57/lb Copper – – Total Gold Cash Cost Less Than $50/Oz net of Copper Credits Total Gold Cash Cost Less Than $50/Oz net of Copper Credits – – Revenue 60% from Precious Metals 40% from Copper Revenue 60% from Precious Metals 40% from Copper
- Well Financed, Demonstrated Track Record of Growth
Well Financed, Demonstrated Track Record of Growth
SLIDE 51 Resources Inc.
AMEX, TSX: NG