
SLIDE 1
Corporate Presentation August 2018 SEABRIDGE GOLD Forward Looking - - PowerPoint PPT Presentation
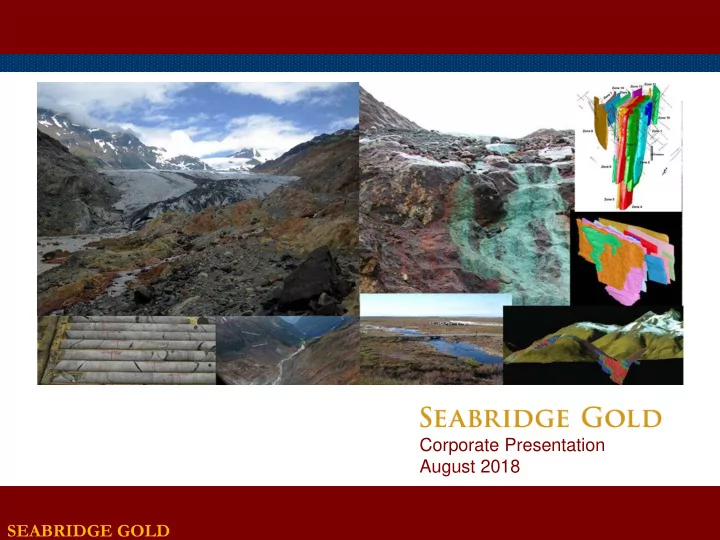
Corporate Presentation August 2018 SEABRIDGE GOLD Forward Looking Statements All reserve and resource estimates reported by the Company were calculated in accordance with the Canadian National Instrument 43-101 and the Canadian Institute of
All reserve and resource estimates reported by the Company were calculated in accordance with the Canadian National Instrument 43-101 and the Canadian Institute of Mining and Metallurgy Classification system. These standards differ significantly from the requirements of the U.S. Securities and Exchange Commission. Mineral resources which are not mineral reserves do not have demonstrated economic viability. Statements relating to the estimated or expected future production and operating results and costs and financial condition of Seabridge, planned work at the Company’s projects and the expected results of such work are forward-looking statements within the meaning of the United States Private Securities Litigation Reform Act of 1995. Forward-looking statements are statements that are not historical facts and are generally, but not always, identified by words such as the following: expects, plans, anticipates, believes, intends, estimates, projects, assumes, potential and similar expressions. Forward-looking statements also include reference to events or conditions that will, would, may, could or should occur. Information concerning exploration results and mineral reserve and resource estimates may also be deemed to be forward-looking statements, as it constitutes a prediction of what might be found to be present when and if a project is actually developed. These forward-looking statements are necessarily based upon a number of estimates and assumptions that, while considered reasonable at the time they are made, are inherently subject to a variety of risks and uncertainties which could cause actual events or results to differ materially from those reflected in the forward-looking statements, including, without limitation: uncertainties related to raising sufficient financing to fund the planned work in a timely manner and on acceptable terms; changes in planned work resulting from logistical, technical or other factors; the possibility that results of work will not fulfill projections/expectations and realize the perceived potential of the Company’s projects; uncertainties involved in the interpretation of drilling results and other tests and the estimation of gold reserves and resources; risk
environmental issues at the Company’s projects; the possibility of cost overruns or unanticipated expenses in work programs; the need to obtain permits and comply with environmental laws and regulations and other government requirements; fluctuations in the price of gold and other risks and uncertainties, including those described in the Company’s Annual Information Form filed with SEDAR in Canada (available at www.sedar.com) for the year ended December 31, 2017 and in the Company’s Annual Report Form 40-F filed with the U.S. Securities and Exchange Commission on EDGAR (available at www.sec.gov/edgar.shtml). Forward-looking statements are based on the beliefs, estimates and opinions of the Company’s management or its independent professional consultants on the date the statements are made.
2
Au and 0.21% Cu)
Proven and Probable Reserves
Low Share Dilution
Low Valuation
Low Political Risk
higher grade reserves to improve project economics Exploration Upside
New Acquisitions
3
4
Source: Company data. Data as of July 31, 2018. Note: Companies shown include North America’s largest gold companies and selected gold project development companies.
30 45 60 75 Newmont Polyus Barrick Newcrest Goldcorp Anglogold Seabridge Kinross Agnico-Eagle Polymetal NovaGold Detour New Gold Yamana Alamos Pretium Buenaventura
45M oz Gold Reserves (m oz)
5
Source: Company data. Data as of July 31, 2018. Note: Companies shown include North America’s largest gold companies and selected gold project development companies.
0.40 0.60 0.80 Seabridge Polyus Newmont Anglogold Detour Agnico-Eagle Newcrest Goldcorp Barrick NovaGold Pretium Polymetal New Gold Alamos Kinross Yamana Buenaventura
0.76 Reserve oz/share Gold Reserves per Common Share
6
Source: Company data. Data as of July 31, 2018. Note: For a breakdown of Seabridge’s mineral reserves and resources by project, tonnes and grade, please visit http://seabridgegold.net/resources.php
20 30 40 50 60 70 80 90 100 110 120
20 30 40 50 60 70 80 90 100 110 120 2003 2004 2005 2006 2007 2008 2009 2010 2011 2012 2013 2014 2015 2016 2017 Shares Outstanding (Millions) Ounces of Gold (Millions) Proven & Probable Gold Reserves Measured & Indicated Gold Resources Inferred Gold Resources Shares Outstanding
7
Source: Company and index data Note: Price Performance represents performance over time from January 2000 through July 2018.
(100%) 400% 900% 1,400% 1,900% 2,400% 2,900% 3,400% 3,900% 4,400% 4,900% 5,400% 5,900% 6,400%
00 01 02 03 04 05 06 07 08 09 10 11 12 13 14 15 16 17 18
Seabridge Newmont Barrick Goldcorp HUI Gold
Price Performance:
+2,070% +331% +425% +153% (32%) +80%
8
Source: Company data. Data as of July 31, 2018. (1) Enterprise Value calculated as market capitalization (basic) plus net debt and minority interest Note: Companies shown include North America’s largest gold companies and selected gold project development companies
$100 $150 $200 $250 $300 $350 Yamana Newmont Barrick Polymetal Pretium Goldcorp Newcrest Kinross Alamos Polyus New Gold Detour Anglogold NovaGold Seabridge
Enterprise Value per Reserve oz $15/oz
Anna, Tintaya)
(Batu Hijau, Grasberg, Tujuh Bukit)
government agencies
9
gold/copper project (by reserves)
Columbia near past producers
well below current industry averages
capital efficiency
approved July 30, 2014. Federal approval received December 2014
key Treaty Nation
deposits add significant upside potential
10
11
12
13
14
Note: Reserves were calculated using $1200 gold, $2.70 copper and $17.50 silver
Zone Mining Method Reserve Category Millions Tonnes Average Grades Contained Metal Gold (gpT) Copper (%) Silver (gpT) Gold (million
Copper (million pounds) Silver (million
Mitchell Open Pit Proven 460 0.68 0.17 3.1 10.1 1,767 45 Probable 481 0.63 0.16 2.9 9.7 1,677 44 Block Cave Probable 453 0.53 0.17 3.5 7.7 1,648 51 Iron Cap Block Cave Probable 224 0.49 0.20 3.6 3.5 983 26 Sulphurets Open Pit Probable 304 0.59 0.22 0.8 5.8 1,495 8 Kerr Open Pit Probable 276 0.22 0.43 1.0 2.0 2,586 9 Totals Proven 460 0.68 0.17 3.1 10.1 1,767 45 Probable 1,738 0.51 0.22 2.5 28.7 8,388 138 Total 2,198 0.55 0.21 2.6 38.8 10,155 183
15
Note: Numbers above have been rounded.
16
Note: For Operating and Total Costs, copper, silver and molybdenum revenues are taken as a by-product credits. Total Costs include all Initial Capital, Sustaining Capital and Closure Costs. Numbers above have been rounded.
Case Unit Base Alternate Q3 2016 Spot Initial Capital Cost $M $5,000 $5,000 $4,800 Net Cash Flow $M $15,900 $26,300 $16,100 NPV @ 5% $M $3,300 $6,500 $3,500 Internal Rate of Return % 10.4% 14.6% 11.1% Payback Period years 6.0 4.1 5.6 Operating Costs (LOM) $/oz Au $277 $183 $404 Total Costs (includes all capital) $/oz Au $673 $580 $787 Metal Prices: Gold $/oz $1,230 $1,500 $1,350 Copper $/lb $2.75 $3.00 $2.20 Silver $/oz $17.75 $25.00 $20.00 Molybdenum $/oz $8.49 $10.00 $7.00 US$/Cdn$ Exchange Rate
0.80 0.77
17
Note: Taxes include B.C. Mineral Tax plus Canadian Federal and B.C. Corporate Income Taxes. Numbers above have been rounded.
Case Unit Base Alternate Q3 2016 Spot Initial Capital Cost $M $5,000 $5,000 $4,800 Net Cash Flow $M $10,000 $16,700 $10,100 NPV @ 5% $M $1,500 $3,700 $1,700 Internal Rate of Return % 8.0% 11.4% 8.5% Payback Period years 6.8 4.9 6.4 Metal Prices: Gold $/oz $1,230 $1,500 $1,350 Copper $/lb $2.75 $3.00 $2.20 Silver $/oz $17.75 $25.00 $20.00 Molybdenum $/lb $8.49 $10.00 $7.00 US$/Cdn$ Exchange Rate 0.80 0.80 0.77
18
2000m Elev.
4000m Elev.
CAVE MODELS
2000m
2016 NSR BLOCK MODEL
> $ 48 24-48 16-24
NSR $/T
PIT MODELS
Proposed Exploration Adit projected to section 000m Elev. Proposed Access Tunnel projected to section
IRON CAP MITCHELL SULPHURETS KERR
19
20
Note: Mine plans were constructed using $1200 gold, $2.70 copper and $17.50 silver
Zone Mining Method Resource Category Millions Tonnes Average Grades Contained Metal Gold (gpT) Copper (%) Silver (gpT) Gold (million
Copper (million pounds) Silver (million
Mitchell Open Pit M&I 418 0.78 0.20 2.9 10.4 1,783 40 Inferred 12 0.47 0.20 5.2 0.2 50 2 Block Cave M&I 606 0.66 0.20 4.1 12.9 2,726 81 Inferred 87 0.40 0.13 3.1 1.1 259 9 Iron Cap Block Cave Indicated 122 0.64 0.24 4.1 2.5 643 16 Inferred 77 0.46 0.22 3.5 1.1 384 9 Sulphurets Open Pit Indicated 92 0.70 0.29 0.6 2.1 584 2 Inferred 11 0.59 0.25 0.8 0.2 60 Kerr Block Cave Indicated 24 0.26 0.54 1.1 0.2 290 1 Inferred 932 0.31 0.49 1.7 9.3 9,962 52 Totals M&I 1,262 0.69 0.22 3.4 28.0 6,026 139 Inferred 1,119 0.33 0.43 2.0 12.0 10,716 72
21
Note: As the PEA is preliminary in nature, it includes Inferred Mineral Resources that are considered too speculative geologically to have the economic considerations applied to them that would enable them to be categorized as Mineral Reserves, and there is no certainty that the PEA will be realized. Mineral Resources that are not Mineral Reserves do not have demonstrated economic viability. Numbers above have been rounded.
22
Note: For Operating and Total Costs, copper and silver revenues are taken as a by-product credits. Total Costs include all Initial Capital, Sustaining Capital and Closure Costs. As the PEA is preliminary in nature, it includes Inferred Mineral Resources that are considered too speculative geologically to have the economic considerations applied to them that would enable them to be categorized as Mineral Reserves, and there is no certainty that the PEA will be realized. Mineral Resources that are not Mineral Reserves do not have demonstrated economic viability. Numbers above have been rounded.
Case Unit Base Alternate Q3 2016 Spot Initial Capital Cost $M $5,500 $5,500 $5,300 Net Cash Flow $M $26,300 $38,700 $24,100 NPV @ 5% $M $6,100 $10,200 $5,700 Internal Rate of Return % 12.7% 16.9% 12.9% Payback Period years 5.6 3.9 5.3 Operating Costs (LOM) $/oz Au
$32 Total Costs (includes all capital) $/oz Au $358 $218 $553 Metal Prices: Gold $/oz $1,230 $1,500 $1,350 Copper $/lb $2.75 $3.00 $2.20 Silver $/oz $17.75 $25.00 $20.00 US$/Cdn$ Exchange Rate 0.80 0.80 0.77
23
Note: Taxes include B.C. Mineral Tax plus Canadian Federal and B.C. Corporate Income Taxes. As the PEA is preliminary in nature, it includes Inferred Mineral Resources that are considered too speculative geologically to have the economic considerations applied to them that would enable them to be categorized as Mineral Reserves, and there is no certainty that the PEA will be realized. Mineral Resources that are not Mineral Reserves do not have demonstrated economic viability. Numbers above have been rounded.
Case Unit Base Alternate Q3 2016 Spot Initial Capital Cost $M $5,500 $5,500 $5,300 Net Cash Flow $M $16,700 $24,700 $15,300 NPV @ 5% $M $3,400 $6,000 $3,200 Internal Rate of Return % 10.0% 13.4% 10.1% Payback Period years 6.4 4.7 6.1 Metal Prices: Gold $/oz $1,230 $1,500 $1,350 Copper $/lb $2.75 $3.00 $2.20 Silver $/oz $17.75 $25.00 $20.00 US$/Cdn$ Exchange Rate 0.80 0.80 0.77
25
North Area 2017 Drilling NSR $/T
> 75 50 – 75 25 – 50 16 - 25
555m El. Conceptual Cave Footprint 1200m El. Conceptual Cave Footprint 870m El. Conceptual Cave Footprint Proposed Access Tunnels
Indicated Resource
27
NSR Cutoff (C$) Resource Category Tonnes (millions) Average Grades Contained Metal Gold (gpt) Copper (%) Silver (gpt) Moly (ppm) Gold (000
Copper (million pounds) Silver (000
Moly (million pounds) 16 Indicated 370 0.43 0.23 4.2 48 5,112 1,874 49,931 48 Inferred 1,297 0.48 0.30 2.9 34 20,023 8,579 120,970 34 20 Indicated 298 0.49 0.24 4.4 50 4,688 1,574 42,095 50 Inferred 1,098 0.52 0.32 3.0 33 18,364 7,747 105,948 33 24 Indicated 227 0.55 0.26 4.5 46 4,007 1,299 32,785 46 Inferred 875 0.58 0.35 3.0 32 16,318 6,751 84,405 32 28 Indicated 166 0.62 0.27 4.7 35 3,302 986 25,029 35 Inferred 670 0.65 0.39 3.0 29 13,999 5,758 64,608 29 32 Indicated 118 0.70 0.29 4.6 26 2,666 757 17,519 26 Inferred 517 0.73 0.42 3.0 27 12,131 4,784 49,851 31
500m
North Area 2017 Drilling
555m El. Conceptual Cave 1200m El. Conceptual Cave 870m El. Conceptual Cave Proposed Access Tunnels
Mineralization is open down plunge to NW
NSR $/T > 75 50 – 75 25 – 50 16 – 25 12 – 16 8 – 12 4 – 8 0 - 4
Limits of Inferred Resource
29
– Demonstrating that year round
– Additionally, with mines scheduled
30
31
Case Unit Base Alternate Gold Price $/oz $1,384 $1,925 Initial Capital Cost $M $1,520 $1,520 Mine Life years 15.0 15.0 Average Annual Gold Production
385,000 385,000 Net Cash Flow $M $1,507 $4,519 NPV @ 5% $M $303 $2,080 Internal Rate of Return % 7.3% 18.7% Payback Period years 11.2 4.0 Operating Costs (years 1-5) $/oz Au $674 $689 Operating Costs (LOM) $/oz Au $780 $796 Total Costs (includes all capital) $/oz Au $1,123 $1,141 US$/Cdn$ Exchange Rate
0.99x
32
Note: Taxes include all Provincial taxes plus Federal Corporate Income Tax.
33
– Owned 100% by Seabridge
– With potentially higher grades
34
35
Note: Mineral resources which are not mineral reserves do not have demonstrated economic viability. Inferred mineral resources have a high degree of uncertainty as to their existence, and great uncertainty as to their economic and legal feasibility. It cannot be assumed that all or any part of an inferred resource will ever be upgraded to a higher category.
Cut-Off Gold Grade Tonnes Grade Inferred (g/T) (K) g/t (K oz) 0.20 6,647 2.37 506 0.30 5,987 2.60 500 0.40 5,477 2.81 495 0.40 5,022 3.03 489
0.60 4,624 3.24 482
0.70 4,278 3.45 475 0.80 3,986 3.65 468 0.90 3,727 3.84 460 1.00 3,512 4.02 454
36
38
39
40
41
42
43
Source: S&P Global Market Intelligence, Paradigm Capital
44 Source: S&P Global Market Intelligence, Seabridge Gold Inc.
124.6 86.5 43.4 73.1 46.6 33.2 16.7 nil 64.4 68.5 53.5 49.5 25.9 62.0 20.6 45.3 Barrick Newmont Goldcorp AngloGold Kinross Newcrest Agnico-Eagle Seabridge
2007 Reserves vs. 2017 Reserves for Select Major Gold Companies
2007 Reserves (m oz) 2017 Reserves (m oz)
45
(2) Source: Consensus estimate. Includes CPM Group, GFMS and Metals Focus
46 Source: S&P Global Market Intelligence, Seabridge Gold Inc.
$203 $191 $221 $135 $857 $291 $327 nil $76 $63 $63 $97 $129 $38 $83 $6 Barrick Newmont Goldcorp AngloGold Kinross Newcrest Agnico-Eagle Seabridge
Cost Per Gold Ounce of Acquisition vs. Exploration from 2008 - 2017
Acquisition-derived reserves Exploration-derived reserves
47 Source: S&P Global Market Intelligence, Seabridge Gold Inc.
11.0 9.5 23.2 7.5 10.0 31.6 5.4 nil 27.6 36.9 23.9 27.9 8.9 22.3 11.0 45.3 Barrick Newmont Goldcorp AngloGold Kinross Newcrest Agnico-Eagle Seabridge
Gold Ounces Added by Acquisition vs. Exploration from 2008 - 2017
Au Oz Added by Acquisition (m oz) Au Oz Added by Exploration (m oz)
Enhanced De- Risking Premium
social license in Canada
Outstanding Exploration Record
25 Bn lbs Cu added
superior grades
replacing production: in- ground resources will soon be re-valued
Snowstorm have best-
adding resources
Joint Ventures
for a production JV on friendly terms
more deal-capable
companies under CA
improve
need improved market conditions 48
Leverage to the Gold Price
in a gold bull market
Weiss, TD Bank, Sprott, Fidelity, Paulson & Co.
$160 million in cash)
49
50
publicly traded companies including Greenstone Resources, Columbia Resources, Behre Dolbear & Company, Riverside Associates, Phibro-Salomon, Amax, and DRX
Rudi Fronk
Co-Founder, Chairman & CEO
the technical programs required to advance Seabridge's two main assets towards feasibility
Jay Layman
Director, President & COO
Seabridge’s exploration and resource delineation programs
Bill Threlkeld
Senior VP, Exploration
Peter Williams
Senior VP, Technical Services
Christopher Reynolds
VP, CFO
environmental programs and community engagement strategies
Brent Murphy
VP, Environmental Affairs
1993 and has been counsel to Seabridge Gold since 1999
Bruce Scott
VP, Corporate Affairs
51
recognized as the pre-eminent reserves modeling and mine design software system with more than 300 installations worldwide
Frederick Banfield
geologists in the mining industry. Ran global exploration for Placer Dome from 1989 through 2001
Eliseo Gonzalez-Urien Chair, Compensation Committee
Richard Kraus Chair, Audit Committee
John Sabine Chair, Governance and Nominating Committee
including KSM
Clem Pelletier Chair, Technical Committee
Gary Sugar