
SLIDE 1
Corporate Presentatio n
May 2017
Corporate Result Presentatio Presentation n May May 2019 2017 - - PowerPoint PPT Presentation
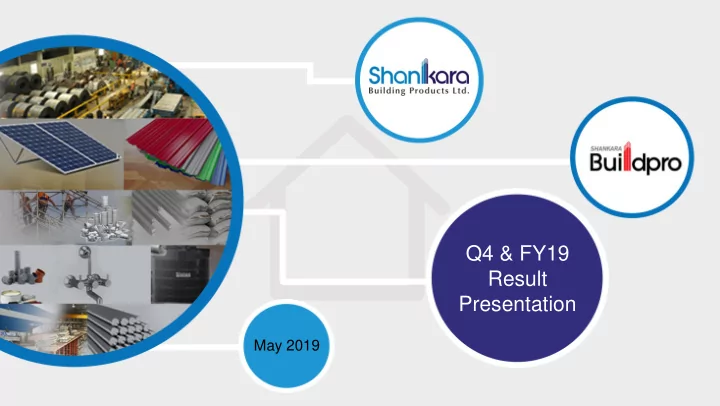
Q4 & FY19 Corporate Result Presentatio Presentation n May May 2019 2017 Safe fe Ha Harbor or 2 This presentation and the accompanying slides (the Presentation), which has been prepared by Shankara Building Products Limited
May 2017
This presentation and the accompanying slides (the “Presentation”), which has been prepared by Shankara Building Products Limited (the “Company”), has been prepared solely for information purposes and do not constitute any offer, recommendation or invitation to purchase or subscribe for any securities, and shall not form the basis or be relied on in connection with any contract or binding commitment whatsoever. No offering of securities of the Company will be made except by means of a statutory offering document containing detailed information about the Company. This Presentation has been prepared by the Company based on information and data which the Company considers reliable, but the Company makes no representation
Certain matters discussed in this Presentation may contain statements regarding the Company’s market opportunity and business prospects that are individually and collectively forward-looking statements. Such forward-looking statements are not guarantees of future performance and are subject to known and unknown risks, uncertainties and assumptions that are difficult to predict. These risks and uncertainties include, but are not limited to, the performance of the Indian economy and of the economies of various international markets, the performance of the tire industry in India and world-wide, competition, the company’s ability to successfully implement its strategy, the Company’s future levels of growth and expansion, technological implementation, changes and advancements, changes in revenue, income or cash flows, the Company’s market preferences and its exposure to market risks, as well as other risks. The Company’s actual results, levels of activity, performance or achievements could differ materially and adversely from results expressed in or implied by this Presentation. The Company assumes no obligation to update any forward- looking information contained in this Presentation. Any forward-looking statements and projections made by third parties included in this Presentation are not adopted by the Company and the Company is not responsible for such third party statements and projections. 2
3
INCREASE in share of Retail Business
53% 51% Q3FY19 Q1FY19 57% Q2FY19 Q4FY19 55% 129 102 86 84 Q1FY19 Q4FY19 Q2FY19 Q3FY19
Conscious DEFOCUS on Channel Business
418 365 343 334 Q2FY19 Q1FY19 Q3FY19 Q4FY19
REDUCTION in Debtors
0.70 0.72 0.70 0.38 Q1FY19 Q2FY19 Q3FY19 Q4FY19
Rationalizing Debt : Equity Ratio
Strong ng Operat erating ng Cash sh Flow
4
superior margin business with a higher return on equity
expanding our Retail presence through Shankara Buildpro stores.
led to sub optimal margins thus dragging down our overall profitability and return ratios
Processing Business Q1FY19 Q2FY19 Q3FY19 Q4FY19 FY19 Effect on Margins Processing Margins (%) 4.9% 4.1% 2.3% 2.5% 3.6% Retail Segment Margins (in %) (Impact of lower processing margins on retail business) 10.3% 9.7% 7.9% 7.3% 8.8%
margins is being mitigated
undertaking trading activities in standardized products available in the market.
*Subject to shareholders approval at the EGM
subsidiary Taurus Value Steel & Pipes Pvt. Ltd., located in Chegunta near Hyderabad (Telangana)*
stronger consolidated balance sheet
5
Offering end to end Home Improvement & Building Material products being a One Stop Shop Solution for building products for our customers Increasing Product Offerings and Creating Depth in the existing product categories to create an engaging shopping experience for customers
Expanding Retail Presence
through
and inorganic routes to address the growing demand for home building and improvement products Enhancing the Brand Equity of our Shankara Buildpro stores to ensure high level of trust, authenticity and selection of various products and brands With expansion in our retail presence, customer base and geography, our core focus will be to continue on a Financially Prudent Path
One sto top p shop Product
fferi ering ngs Reta tail il Presen ence ce Brand d Equity ity Financi nancial l Prudence rudence
6
Customer outreach Orientation sessions Customer meets
Click Here for our blog for various Customer Meets, Fares & Event, Training Session and Recognition received from Suppliers and Customers
Organizing customer meets across locations to showcase the wide range of product offerings Over 150+ influencer meets held
Most
the meets held in collaboration with partner brands Localized marketing efforts – newspaper inserts, pamphlet distribution, direct
to construction sites etc. Product training sessions in collaboration with various brands for better understanding and insights on the products we offer and their usage
7
Overall company revenues grew by 4% for FY19 Retail segment is a strong focus area for the Company and grew by 17% in FY19 Channel business is being consciously shrunk and has declined by 23%
5,240 4,010 FY18 FY19
25,487 26,541 FY18 FY19 +4% 12,197 14,311 FY18 FY19 +17% 8,050 8,220 FY18 FY19 +2%
Retail Revenue Enterprise Revenue Channel Revenue Total Revenue
FY18 Revenue mix across States
8 47.5% 6.5% 12.1% 11.8% 11.0% 11.1% Karnataka Andhra Pradesh Telengana Kerala Tamil Nadu Other States 46.2% 5.9% 13.9% 9.9% 11.9% 12.2% Karnataka Andhra Pradesh Telengana Kerala Tamil Nadu Other States
FY19 Revenue mix across States
Telengana and Tamil Nadu have recorded strong growth
Particulars Units FY19 FY18 Y-o-Y No of retail stores Nos. 134 129 4% Total Area
5,67,202 5,05,034 12% Average store size
4,233 3,915 8% Average ticket size Rs. 28,003 25,665 9% Revenue from retail stores
14311 12,197 17% EBITDA
1,265 1,303
Margin (%) % 8.8% 10.7%
EBITDA per store
94.43 101.01
Average rental cost per Sq. Ft. per month Rs. 19.10 16.99 12%
9
10
Particulars (Rs. Mn) Q4 FY19 Q4 FY18 FY19 FY18 Total Income 6,197 7,608 26,541 25,487 Raw Material 5,627 6,585 23,594 21,986 Employee Expenses 151 147 642 559 Other Expenses 253 335 1,109 1,189 EBITDA 164 541 1,197 1,752 EBITDA % 2.7% 7.1% 4.5% 6.9% Other Income 22 1 42 6 Depreciation 46 43 186 136 Finance Cost 124 137 567 463 Profit before Tax 16 362 485 1,159 Tax 146 158 421 Profit after Tax 16 216 327 738 Cash Profit 63 259 514 874 EPS 0.71 1.11 14.33 32.30
Low Revenue growth was on account of consolidation of our business and degrowth in our channel business while concentrating
Low margins for the year were due to increase in Raw Material cost over the last
consolidating our stores and reducing the
expenses which is evident by decrease of other expenses in Q4FY19 by 24% YoY to Rs. 253 Mn. Increase in other income was on account of receipt of insurance claim up to the tune of
property in Q3FY19. Increase in depreciation was on account of amortization
goodwill from
acquisitions of Vaigai & JP Sanitation and capitalisation of assets for upgrading the existing stores. Finance cost has reduced to Rs. 124 Mn a decrease of ~23% QoQ; further reduction is targeted in coming quarters.
*Financial Data as per IND AS
11
*Financial Data as per IND AS
Particulars (Rs. Mn) Mar-19 Mar-18 Total Equity 4,791 4,558 Equity Share Capital 228 228 Other Equity 4,562 4,329 Non-Controlling Interest 1 1 Non-current liabilities 235 181 Financial Libilities (i) Borrowings 24 9 (ii) Other Financial Liabilities
3 3 Deferred Tax Liabilities (Net) 206 169 Current liabilities 6,094 7,389 Financial Liabilities (i) Borrowings 1,927 2,420 (ii) Trade Payables 3,814 4,605 (iii) Other Financial Liabilities 167 189 Provisions 20 10 Current Tax Liabilities (Net) 23 81 Other Current Liabilities 143 85 Total Liabilities 11,120 12,128 Particulars (Rs. Mn) Mar-19 Mar-18 Non-current assets 2,773 3,208 Property, Plant and Equipment 2,252 2,726 Investment Property 71 1 Capital Work in Progress 43
66 104 Goodwill on Consolidation 140 140 Financial Assets (i) Trade Receivables 40 31 (ii) Loans 148 180 Other non-current assets 14 26 Current assets 8,346 8,919 Inventories 3,829 4,157 Financial Assets (i) Trade receivables 3,336 4,241 (ii) Cash and cash equivalents 92 12 (iii) Bank balances other than above 83 48 (iv) Others financial assets 13 12 Other Current Assets 296 450 Current Assets Net 7
691
11,120 12,128
12
*Financial Data as per IND AS
Our constant focus on better Inventory and Debtor management by encouraging cash sales has substantially increased our operating cash flows to
which has been utilized for debt servicing and repayment
Particulars (Rs. Mn) FY19
Operating profit before working capital changes 1,195 (Increase) / Decrease in inventories 328 (Increase) / Decrease in trade receivable 920 Decrease / (Increase) in Other Assets 182 (Decrease) / Increase in trade payables (790) (Decrease) / Increase in other liabilities 56 (Decrease) / Increase in provisions 4 Cash Flow from Operations 1,893 Income Tax Paid (179) Net Cash generate from Operating Activities (A) 1,715 Cash flow from Investing Activities Increase in property, plant & equipment (453) Bank deposit bot considered as cash (35) Interest Received 6 Net Cash from Investing Activities (B) (482) Cash flow from Financing Activities Repayment of non-current borrowings (12) Proceeds from current borrowings (493) Interest paid (559) Dividend paid (89) Net Cash from Financing Activities (C) (1,153) Net increase in cash and cash equivalents(A+B+C) 79
Creditor Days Working Capital Days Inventory Days Receivable Days 13
Working Capital Days are calculated on the basis of revenue *FY18 and FY19 days are not comparable to earlier periods due to GST impact on revenue
47 48 50 49 FY16 FY14 FY19 FY15 46* FY17 FY18 61* 42 43 46 44 FY17 FY14 FY16 FY15 FY18 FY19 60* 53* 66 65 54 52 FY18 FY14 FY15 FY19 FY16 46* FY17 54* 23 25 42 41 FY14 FY16 FY15 FY17 FY19 FY18 66* 52*
Net Debt : Equity Average Return on Capital Employed FY14 FY17 FY15 FY18 FY16 15% FY19 17% 21% 25% 25% 16% 9% FY14 FY15 FY18 FY17 FY16 FY19 13% 15% 17% 17% 7% 14 1.4 1.2 0.8 0.6 0.5 0.4 FY14 FY15 FY16 FY17 FY18 FY19
Average Return on Equity
Company : Investor Relations Advisors : CIN - U26922KA1995PLC018990
www.shankarabuildpro.com CIN - U74140MH2010PTC204285
sagar.shroff@sgapl.net / shogun.jain@sgapl.net +91 98205 19303 / +91 77383 77756 www.sgapl.net
For further information, please contact: 15