
SLIDE 1
Copper, Nickel & Precious Metals in the U.S. August 2015 - - PowerPoint PPT Presentation
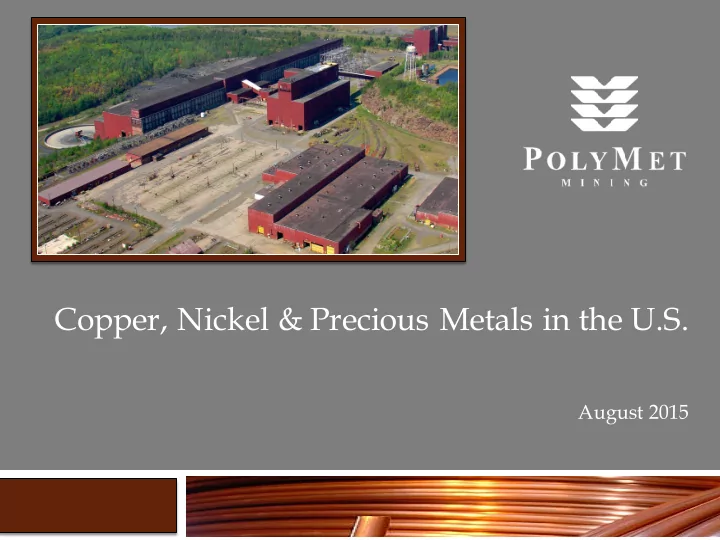
Copper, Nickel & Precious Metals in the U.S. August 2015 Cautionary Statement This presentation contains certain forward-looking statements concerning anticipated developments in PolyMet Mining Corp. (PolyMet)s operations in the
This presentation contains certain forward-looking statements concerning anticipated developments in PolyMet Mining Corp. (“PolyMet”)’s
“believes,” “intends,” “estimates,” “potential,” “possible,” “projects,” “plans,” and similar expressions, or statements that events, conditions
These forward-looking statements may include statements regarding our beliefs related to the expected project timelines, exploration results and budgets, reserve estimates, mineral resource estimates, continued relationships with current strategic partners, work programs, capital costs and expenditures, actions by government authorities, including changes in government regulation, the market price of natural resources, estimated production rates, costs, ability to receive environmental and operating permits, construction costs and hours created, job creation and other economic benefits, or other statements that are not a statement of fact. Forward-looking statements address future events and conditions and therefore involve inherent known and unknown risks and
hazards, inherent uncertainties in interpreting engineering and geologic data, fluctuations in commodity prices and prices for operational services, government regulation and foreign political risks, fluctuations in the exchange rate between Canadian and US dollars and other currencies, as well as other risks commonly associated with the industry. Actual results may differ materially from those in the forward- looking statements due to risks facing PolyMet or due to actual facts differing from the assumptions underlying its predictions. In connection with the forward-looking information contained in this presentation, PolyMet has made numerous assumptions, regarding, among other things: the geological, metallurgical, engineering, financial and economic advice that PolyMet has received is reliable, and is based upon practices and methodologies which are consistent with industry standards. While PolyMet considers these assumptions to be reasonable, these assumptions are inherently subject to significant uncertainties and contingencies. PolyMet’s forward-looking statements are based on the beliefs, expectations and opinions of management on the date the statements are made, and PolyMet does not assume any obligation to update forward-looking statements if circumstances or management’s beliefs, expectations and opinions should change. Specific reference is made to PolyMet’s most recent Annual Report on Form 20-F for the fiscal year ended January 31, 2015 and in our other filings with Canadian securities authorities and the U.S. Securities and Exchange Commission, including our Report on Form 6-K providing information with respect to our operations for the three months ended April 30, 2015, for a discussion of some of the risk factors and other considerations underlying forward-looking statements. PolyMet’s financial statements have been prepared in accordance with International Financial Reporting Standards ("IFRS"). All amounts are in U.S. funds.
nickel-platinum group metals (PGMs)
plant capacity
Jon Cherry President, CEO, Director
Leader in mining environmental policy and new mining projects, 20 years with Rio Tinto in the U.S. 23 years experience in the industry
Douglas Newby Chief Financial Officer
Mine finance expert, former Chairman/CEO of Western Goldfields (now New Gold) ~30 years experience
Brad Moore Executive VP – Environmental and Government Affairs
Permitting and regulatory expert, former senior Minnesota government official
Andrew Ware Chief Geologist
Expert on the Duluth Complex and the mid-Continent Rift, broad experience in SE Asia and
4
Alan Watts, director, EPA Office of Enforcement and Compliance, Chicago March 13, 2014 SDEIS Comment letter
7
5 8
NorthMet 15.4 billion lbs. Cu Eq. Measured Indicated and Inferred
The largest ore deposits in the USA are plotted on this
Complex is larger in terms of contained metal content and tonnage than any
Deposits
1 100 10,000 1000
Ore, Millions of Tonnes
Disseminated, polymetallic deposit Low strip (waste:ore) ratio (1.4:1 life-of-mine), minimal over-burden, based on $1.25/lb copper
10
The image part with relationship ID rId2 was not found in the file.
9
Global resource = 15.4 billion pounds copper equivalent Measured & indicated resource = 10.3 billion pounds copper equivalent Mine plan = 3.6 billion pounds copper equivalent at $1.25/lb copper cutoff
11
m lbs Global Resource (2) Measured 234.4 212.6 0.73% 3,431 Indicated 654.2 593.5 0.63% 8,202 M + I 888.6 806.1 0.65% 11,633 Inferred 289.6 262.7 0.66% 3,813 TOTAL 1,178.2 1,068.8 0.66% 15,447 Mineral Resources (3) Measured 202.5 183.7 0.79% 3,204 Indicated 491.7 446.1 0.72% 7,052 M + I 694.2 629.8 0.74% 10,256 Inferred 229.7 208.4 0.75% 3,446 TOTAL 923.9 838.1 0.74% 13,701 Reserves 274.7 249.2 0.79% 4,340 Mine Plan (4) 231.1 209.7 0.77% 3,565
Notes 1 Metals converted to copper based on 2008 DFS Update metal prices 2 0.1% copper cut-off 3 $7.42/lb net metal value cut-off - January 2013 43-101 ($1.25/lb copper) 4 20-year mine plan subject to permit applications ($1.25/lb copper)
million st million mt (%) Copper Equivalent (1) Tonnage
Tailings basin Road and Railroad Crushing and Grinding Mills Water System Electrical System Warehouses and workshops
12
34 parallel circuits – operating plan uses only 12 Each circuit ~ 3,000 tons per day capacity
13
14
Stock Snapshot
NYSE-MKT: PLM / TSX: POM Recent Share (NYSE-MKT / TSX) $0.92 / C$1.20 52 week range (NYSE-MKT / TSX) $1.37 – 0.88 / C$1.75 – $1.14 Trading volume (NYSE-MKT / TSX) 198,000 / 20,000 (200-day average) Market capitalization $255 / C$332 million Cash + credit facility (April 30, 2015) $23.9 million
Capital Structure
Shares outstanding 276.6 million Glencore convertible debt $34.2 million at $1.29 per share Glencore Warrants 6.5 million@ $0.92 expire 12/2016 Other Warrants 1.7 million@ average $1.53 expire 12/2015 Options & incentives 23.1 million@ average $1.36 Fully diluted 334.0 million (including out-of-money options/warrants)
15
16
Chief Financial Officer Douglas Newby +1 (651) 389-4105 dnewby@polymetmining.com Investor Relations Jenny Knudson +1 (651) 389-4110 jknudson@polymetmining.com
17