SLIDE 1 Construction and Long Construction and Long-
Term Performance of Innovative Geotechnologies Innovative Geotechnologies
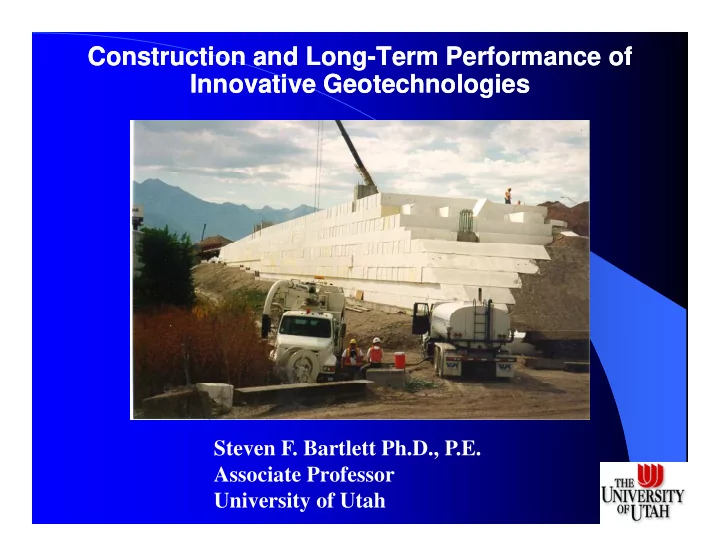
Steven F. Bartlett Ph.D., P.E. Steven F. Bartlett Ph.D., P.E. Associate Professor University of Utah
SLIDE 2 I-
15 Project Limits
- Approx. 100,000 cubic meters of geofoam was placed
SLIDE 3 I-
15 Reconstruction -
Quick Facts
- Single Largest Design-Build Highway Contract in U.S.
- 17 Miles of Urban Interstate
17 Miles of Urban Interstate
- $1.5 Billion (Project Cost)
- Wasatch Constructors (Prime Contractor)
- 4 Year Construction Duration (1997 - 2001)
- 144 Bridges/Overpass Structures
144 Bridges/Overpass Structures
- 160 Retaining Walls (mostly MSE Walls)
- $350 K Embankment Study
SLIDE 4 Geotechnical Issues Geotechnical Issues
- Large Primary Consolidation Settlement (1 to 1.5 m)
g y ( )
- Time Rate of Consolidation (2 years to end of primary)
- Creep Settlement (Bump at Bridge)
- Creep Settlement (Bump at Bridge)
- Foundation Stability (Large Embankments on Soft Soils)
- Schedule Constraints (two 2-year projects)
- Maintenance of Traffic (Had to be maintained)
- New Technologies and Development of Specifications
SLIDE 5 Subsurface Profile in Salt Lake Valley Subsurface Profile in Salt Lake Valley
Upper Bonneville Clay Lower Bonneville Clay Interbeds
SLIDE 6
Settlement of Soft Clays Settlement of Soft Clays in Salt Lake Valley in Salt Lake Valley
Approximate 2 years of primary settlement
SLIDE 7 I-
- 15 Embankment Construction
15 Embankment Construction 2-
- stage MSE wall with surcharge
stage MSE wall with surcharge g g g g
SLIDE 8
Prefabricated Vertical Drains Prefabricated Vertical Drains
Installed drain PV Drain Spacing 1.5 to 2.5 m Installed drain PV Drain Spacing 1.5 to 2.5 m triangular spacing PV drain pushed into ground Placement of anchor bar
SLIDE 9 2-
Stage MSE Walls
Right-of-way constraints required many slopes to be built vertically. y p y Beginning of 2-stage MSE Wall
SLIDE 10 2-
- Stage MSE Wall Connections
Stage MSE Wall Connections
Female threaded rod coupler Attachment of Panels with threaded rod Concrete Fascia Panel
SLIDE 11 2-
Stage MSE Wall with Prefabricated Vertical Drains Prefabricated Vertical Drains Prefabricated Vertical Drains Prefabricated Vertical Drains Cost and Schedule Comparison Cost and Schedule Comparison
Total cost is for 10 m length of embankment
SLIDE 12 I-
- 15 Embankment Construction
15 Embankment Construction 1 stage MSE wall with lime cement columns stage MSE wall with lime cement columns 1-stage MSE wall with lime cement columns stage MSE wall with lime cement columns
SLIDE 13
Lime Cement Stabilized Soil Lime Cement Stabilized Soil
Auger / Mixer for Lime and Cement Lime Cement Column Rig 125 kg/m3 15% lime 85% cement M = 30 Mpa (design); Su 300 to 400 kPa
SLIDE 14
Lime Cement Column Installation Pattern Lime Cement Column Installation Pattern
SLIDE 15 1-
- Stage MSE Wall Construction
Stage MSE Wall Construction
Finished MSE wall 1-stage MSE placed over columns
SLIDE 16 1-
Stage MSE Wall with Lime Cement Stabilized Soil Lime Cement Stabilized Soil Lime Cement Stabilized Soil Lime Cement Stabilized Soil Cost and Schedule Comparison Cost and Schedule Comparison
Total cost is for 10 m length of embankment
SLIDE 17 I-
15 Reconstruction Geofoam Embankment Geofoam Embankment Geofoam Embankment Geofoam Embankment
SLIDE 18 I-
15 Reconstruction Geofoam Properties Geofoam Properties p
* I-15 used 1.25 pcf density exclusively (i.e., type VIII geofoam)
SLIDE 19 Geofoam (I Geofoam (I-
- 80 State Street to 200 West St.)
80 State Street to 200 West St.)
SLIDE 20
Geofoam Embankment Construction Geofoam Embankment Construction
Base Sand Base Sand Footing for Panel Wall and Block Placement
SLIDE 21
Geofoam Embankment Construction Geofoam Embankment Construction
Geofoam cut and placed around piling at bridge abutment Nearly Completed Geofoam Embankment with Vertical Face Transition Zone with MSE Wall
SLIDE 22
Geofoam Embankment Construction Geofoam Embankment Construction
Completed Load Distribution Slab Reinforced Concrete Load Distribution Slab
SLIDE 23
Geofoam Embankment Finished Geofoam Embankment Finished
SLIDE 24
Geofoam Embankment with Geofoam Embankment with Tilt Tilt up Panel Wall up Panel Wall Tilt Tilt-up Panel Wall up Panel Wall Cost and Schedule Comparison Cost and Schedule Comparison
Total cost is for 10 m length of embankment
SLIDE 25
Final Cost and Schedule Comparison Final Cost and Schedule Comparison p
140 160 100 120 140
Geofoam
60 80
LCC and Wall 2 St MSE
20 40
2-Stage MSE Wall
Cost $10 K Time (weeks) ( )
Cost represents total construction costs for each system for a 10-m long reach of interstate. Construction time is typical for embankments built on the I-15 Reconstruction Project.
SLIDE 26 Performance Monitoring Performance Monitoring Objectives of Geofoam Arrays Objectives of Geofoam Arrays j y j y
M C S ttl t f G f M (10 )
- Measure Creep Settlement of Geofoam Mass (10 yr.)
- Measure the Pressure Distribution within Geofoam
M Diff i l S l i T i i Z
- Measure Differential Settlement in Transition Zones
- Measure Lateral Earth Pressure at Abutments
- Monitor for Differential Icing at Geofoam /
Embankment Transition Zones
- Model Stress / Strain Behavior
Model Stress / Strain Behavior
SLIDE 27 Typical Geofoam Array Typical Geofoam Array
ROW OF SURVEY POINTS AT FACE OF WALL 25 MM - PVC STAND PIPE ROW OF SURVEY POINTS ALONG OUTSIDE EDGE OF EMERGENCY LANE ROW OF SURVEY POINTS ALONG INSIDE EDGE OF MOMENT SLAB CONCRETE PAVEMENT ROAD BASE LOAD DISTRIBUTION SLAB LEVEL 7.5 SQUARE PLATE WITH MAGNET RING LEVEL 6 6.5 TO 7.3 m GEOFOAM BLOCKS LEVEL 4 LEVEL 2 HEIGHT VARIES GRANULAR BACKFILL LEVEL 0 BEDDING SAND 2.5 m VIBRATING WIRE TOTAL PRESSURE CELL
SLIDE 28
3300 South Geofoam Array Installation 3300 South Geofoam Array Installation
Magnet Extensometer and Pressure Cell Installation Pressure Cell Installation Hotwire Cut for Pressure Cell Pressure Cell Cast in Bridge Abutment Pressure Cell in Base Sand
SLIDE 29 3300 South Array Settlement Data 3300 South Array Settlement Data
9 9 9 9 9 9 1 1 1 1 1 01/20/99 03/21/99 05/20/99 07/19/99 09/17/99 11/16/99 01/15/00 03/15/00 05/14/00 07/13/00 09/11/00 11/10/00 01/09/01 03/10/01 05/09/01 07/08/01 09/06/01
10 20 30
mm)
40 50 60
tlement (m
70 80 90
Sett
100
Level 0 Level 2 Level 4 Level 6 L l 8 Construction Completed (7/28/99) Level 8 Level 9 Load Distribution Slab placed Load Distribution Slab Curb placed Granular Borrow Open Graded Base PCCP Pavement
Approx. 1% Construction Strain
SLIDE 30 3300 South Geofoam Array 3300 South Geofoam Array
Damage to Connections During Construction Damage to Connections During Construction g g g g Loading Loading
Damaged Connection
loading strain can be loading strain can be expected.
untrimmed block and elastic compression.
g was later repaired by dowels.
- Rigid connect should be
- Rigid connect should be
avoided.
SLIDE 31
Settlement at Toe of Wall Settlement at Toe of Wall
SLIDE 32 Geofoam Transition Zones Geofoam Transition Zones Post Post-
Construction Settlement
Transition slope 3.5 H : 1 V
25.0
ent
face of wall 5/30/00 face of wall 3/18/01
Transition zone
15.0 20.0
uction Settlem e (m m )
inside edge of moment slab 5/30/00 inside edge of moment slab 3/18/01
Geofoam MSE Wall
0.0 5.0 10.0
Post-Constru (
lane 5/30/00
lane 3/18/01 baseline survey completed on 11/10/99. 25340 25350 25360 25370 25380 25390 25400 25410 25420 25430 25440 25450 25460 25470 25480 25490
Mainline Stationing (m)
SLIDE 33
Settlement Monitoring 100 South Street Settlement Monitoring 100 South Street
projected 0.5 % additional 50 yrs. 1% construction strain
SLIDE 34 Pressure Cell Measurements in Geofoam Pressure Cell Measurements in Geofoam
Pressure Versus Time 3300 South Street Geofoam Array
60 0 70.0 80.0
a)
- Sta. 25+315, Level 0
- Sta. 25+347, Level 0
- Sta. 25+315, Level 6
- Sta. 25+347, Level 5
- Sta. 25+315, Level 9
40.0 50.0 60.0
essure (kPa
,
10 0 20.0 30.0
Pre
0.0 10.0 /20/99 /21/99 /20/99 /19/99 /17/99 /16/99 /15/00 /15/00 /14/00 /13/00 /11/00 /10/00 1/9/01 /10/01 5/9/01 7/8/01 9/6/01 1/5/01 1/ 3/ 5/ 7/ 9/ 11/ 1/ 3/ 5/ 7/ 9/ 11/ 1 3/ 5 7 9 11
Date
SLIDE 35
Geofoam Performance Summary Geofoam Performance Summary Geofoam Performance Summary Geofoam Performance Summary
1. Geofoam fills are performing as expected 2 A i l 1 i l i d d i 2. Approximately 1 percent vertical strain occurred during construction. a. Strain due to seating and compression of geofoam. b. This strain can damage rigid connections. 3. Approximately 0.3 percent creep strain (15 mm) has occurred in the geofoam for an 8-year post construction period. This is acceptable and within the expected performance. 4. The vertical stress distribution that develops in a geofoam wedge p g g fill is complex, but generally diminishes with depth. 5. Pressure cell measurements suggest that approximately 45 kPa of vertical stress has developed in the center of the geofoam mass vertical stress has developed in the center of the geofoam mass. This is approximately 50 percent of the compressive strength of the geofoam.
SLIDE 36 Settlement Comparison Settlement Comparison I-
15 Geotechnologies g
SLIDE 37 Settlement Conclusions Settlement Conclusions G I-
15 Geotechnologies
- Geofoam has met the 75 mm (3 inch) in 10-yr
settlement goal in all cases.
- LCC Treated soil has met the 75 mm in 10-yr
settlement goal. 2 Stage MSE Walls ha e not met the 75 mm in
- 2-Stage MSE Walls have not met the 75 mm in
10-yr settlement goal for the MSE wall and embankments monitored. The expected range
- f settlement for these system is 100 (4 in) to
150 mm (6 in) for a 10-year post construction period. period.
SLIDE 38
Principal Investigators Principal Investigators
bartlett@civil.utah.edu @
SLIDE 39
Published Reports Published Reports
Farnsworth C. F., Bartlett S. F., Negussey, D. and Stuedlein A. 2008, “Construction and Post-Construction Settlement Performance of Innovative Embankment Systems, I-15 i j S l k Ci h ” l f G h i l d i l Reconstruction Project, Salt Lake City, Utah,” Journal of Geotechnical and Environmental Engineering, ASCE (Vol. 134 pp. 289-301). Bartlett, S. F. and Lawton E. C., 2008, “Evaluating the Seismic Stability and Performance of , , , g y Freestanding Geofoam Embankment,” 6th National Seismic Conference on Bridges and Highways, Charleston, S.C., July 27th –30th 2008, 17 p. N M P B tl tt S F L t E C “N i l M d li f G f Newman, M. P., Bartlett S. F., Lawton, E. C., “Numerical Modeling of Geofoam Embankments,” Journal of Geotechnical and Environmental Engineering, ASCE (final review). Bartlett S. F., Farnsworth, C., Negussey, D., and Stuedlein, A. W., 2001, “Instrumentation and Long-Term Monitoring of Geofoam Embankments, I-15 Reconstruction Project, Salt Lake City, Utah,” EPS Geofoam 2001, 3rd International Conference, Dec. 10th to 12th, 2001, Salt Lake City Utah 23 p Salt Lake City, Utah, 23 p.
SLIDE 40
Published Reports Published Reports
Negussey, D., Stuedlin, A. W., Bartlett, S. F., Farnsworth, C., “Performance of Geofoam Embankment at 100 South, I-15 Reconstruction Project, Salt Lake City, Utah,” EPS G f 2001 3 d i l C f 10th 12th 2001 S l k Ci h Geofoam 2001, 3rd International Conference, Dec. 10th to 12th, 2001, Salt Lake City, Utah, 22 p. Bartlett, S. F., Negussey, D., Kimball, M., 2000, “Design and Use of Geofoam on the I-15 , , g y, , , , , g Reconstruction Project,” Transportation Research Board, January 9th to 13th, 2000, Washington, D.C., 20 p. B tl tt S F 2005 “Li ht i ht S l ti ” I f t t T h l S i 2005 Bartlett, S. F., 2005, “Lightweight Solution,” Infrastructure Technology, Spring 2005, pp. 36-40 (Chinese and English). Bartlett, S. F., Negussey, D. and Kimble, M., 2000, “Design of Geofoam Embankments for g y g the I-15 Reconstruction,” Conference on Application and Design of Expanded Polystrene, Sponsored by Taiwan Area National Expressway Engineering Bureau and China Engineering Consultants, Inc., March 3rd, 2000, Taipei, Taiwan, 20 p. (in Chinese).