
SLIDE 1
1
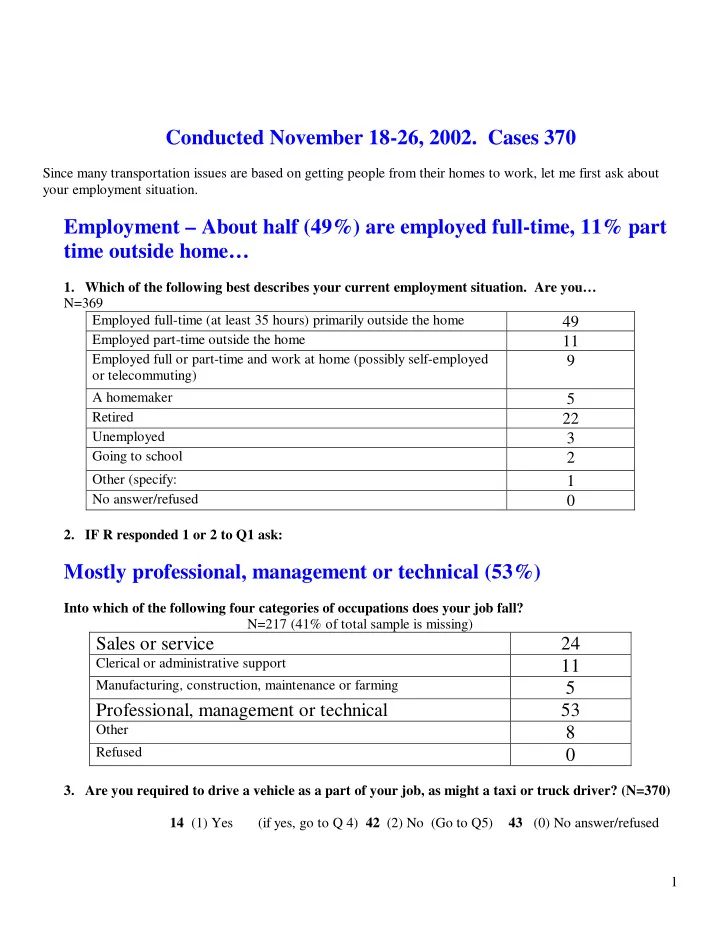
Conducted November 18-26, 2002. Cases 370
Since many transportation issues are based on getting people from their homes to work, let me first ask about your employment situation.
Employment – About half (49%) are employed full-time, 11% part time outside home…
- 1. Which of the following best describes your current employment situation. Are you…
N=369 Employed full-time (at least 35 hours) primarily outside the home
49
Employed part-time outside the home
11
Employed full or part-time and work at home (possibly self-employed
- r telecommuting)
9
A homemaker
5
Retired
22
Unemployed
3
Going to school
2
Other (specify:
1
No answer/refused
- 2. IF R responded 1 or 2 to Q1 ask:
Mostly professional, management or technical (53%)
Into which of the following four categories of occupations does your job fall? N=217 (41% of total sample is missing)
Sales or service 24
Clerical or administrative support
11
Manufacturing, construction, maintenance or farming
5 Professional, management or technical 53
Other
8
Refused
- 3. Are you required to drive a vehicle as a part of your job, as might a taxi or truck driver? (N=370)