
SLIDE 1
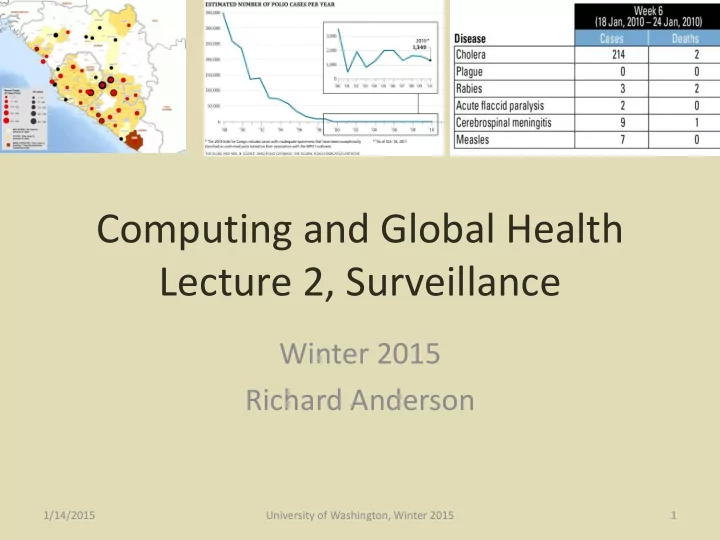
Computing and Global Health Lecture 2, Surveillance
Winter 2015 Richard Anderson
1/14/2015 University of Washington, Winter 2015 1
Computing and Global Health Lecture 2, Surveillance Winter 2015 - - PowerPoint PPT Presentation
Computing and Global Health Lecture 2, Surveillance Winter 2015 Richard Anderson 1/14/2015 University of Washington, Winter 2015 1 Todays topics Surveillance problem Issues Health Information systems HISP/DHIS2
1/14/2015 University of Washington, Winter 2015 1
1/14/2015 University of Washington, Winter 2015 2
1/7/2015 University of Washington, Winter 2015 3
1/14/2015 University of Washington, Winter 2015 4
1/14/2015 University of Washington, Winter 2015 5
1/14/2015 University of Washington, Winter 2015 6
– Roughly 60 diseases listed – Age buckets and gender
1/14/2015 University of Washington, Winter 2015 7
1/14/2015 University of Washington, Winter 2015 8
– Procedures for data collection and use in place – Run by epidemiologists
– Gradually being phased out
1/14/2015 University of Washington, Winter 2015 9
– Breakbone fever – Highly seasonal
– Early warning of outbreaks – Mitigation (e.g., mosquito control) – 2009 Nicaragua introduced a Frontline SMS reporting system
1/14/2015 University of Washington, Winter 2015 10
1/14/2015 University of Washington, Winter 2015 11
1/14/2015 University of Washington, Winter 2015 12
fixed period
implementation, and supervision
1/14/2015 University of Washington, Winter 2015 13
1/14/2015 University of Washington, Winter 2015 14
ALERTS
recalls batch # 2434-FG78.
an adverse event from its latest shipment of Didanosine.
provide a count of batch# 2435-FH95.
Last 24 hours
KEY PERFORMANCE INDICATORS Percent of critical items available within the 100% SCMS system. Percent of non-critical items re-supplied 99% within 30 days. Average number of commodities provided 150 per program. Percentage of emergency orders per month. 3% Number of patients receiving services through SCMS:
72,000
15,000
60,000 Number of sites with deliveries within 7 days: 20 MAP
ALERT (3of 6)
Last 24 hours
ALL CRS FHI FUTU RE CAR E
CRS NO SHORTAGE SHORTAGE STOCKOUT ORDER VOLUME DELIVERY PERFORMANCE
Dashboard
User ID: 20125 Name: Kayode Emeagwali Role: Team Access Country Administrator
More
TRACK AND TRACE Enter Order Number
Search
AFRICAN
CRS CRS CRS
5 8 10 12 14 15 24 26 27 28 29 30
5 10 15 20 25 30 35 JAN-FEB MAR-APR MAY-JUN JUL-AUG SEP-OCT NOV-DEC Average Actual Delivery Days Average Requested Delivery DaysDATE # OF DAYS
2 3 5 8 9 15 3 3 6 5 10 13 2 5 8 10 12 13 3 4 6 12 14 19 10 20 30 40 50 60 70 JAN-FEB MAR-APR MAY-JUN JUL-AUG SEP-OCT NOV-DECORDER VOLUME (in thousands)
CARE FUTURE FHI CRSDATE
2005 2005 ALL CRS FHI FUT URE CAR E OTH ER
ALL ARV DRUG SUPPLY COLOR KEY
30 DAY 60 DAY 90 DAY
30 DAY SITES ARV SITES PARTNER SITES PARTNER SITES ARV DRUG SUPPLY FORECAST Select a date range Select a program
1/14/2015 University of Washington, Winter 2015 16
1/14/2015 University of Washington, Winter 2015 17
1/14/2015 University of Washington, Winter 2015 18
1/14/2015 University of Washington, Winter 2015 19
1/14/2015 University of Washington, Winter 2015 21
1/14/2015 University of Washington, Winter 2015 22
1/14/2015 University of Washington, Winter 2015 23
1/14/2015 University of Washington, Winter 2015 24
1/14/2015 University of Washington, Winter 2015 25
1/14/2015 University of Washington, Winter 2015 26
1/14/2015 University of Washington, Winter 2015 27
1/14/2015 University of Washington, Winter 2015 28
1/14/2015 University of Washington, Winter 2015 29
1/14/2015 University of Washington, Winter 2015 30
1/14/2015 University of Washington, Winter 2015 31
1/14/2015 University of Washington, Winter 2015 32
1/14/2015 University of Washington, Winter 2015 33
1/14/2015 University of Washington, Winter 2015 Page 34
Global Common Architecture
Country Specific Architecture Global Common Solutions Country Specific Solutions
Services in global context Products in global context Products in country context Services in country context 1 2 3 4
Data Sources Integrated Health Information System Policies, Resources and Processes
Census Civil Registration Population Surveys Individual Records Service Records Resource Records
HIS Actors Using Evidence for Decision Making
Senior Country Official National Public Health Official International M&E Officer District Health Manager Senior Country Official Facility Health Officer Civil Society
Integrated Data Repository Extract and Integrate Data
Allocated Length-Of-Stay Utilization 100 200 300 400 500 600 700 Patients Status 143 221 412 574 325 172 68 145 25% 50% 75% 100% 125% 150% 175% 200% Allocated Length-Of-Stay Utilization 100 200 300 400 500 600 700 Patients Status 143 221 412 574 325 172 68 145 25% 50% 75% 100% 125% 150% 175% 200%Dashboard, Reports, Queries, Events & Alerts
Routine and Non-Routine Data Collection Activities
1/14/2015 University of Washington, Winter 2015 35
1/14/2015 University of Washington, Winter 2015 36
1/14/2015 University of Washington, Winter 2015 37
1/14/2015 University of Washington, Winter 2015 38
10/27/2011 University of Michigan 39
CCEM: Cold Chain Equipment Manager Microsoft access software for managing inventory of vaccine cold chain equipment
1/14/2015 University of Washington, Winter 2015 40
1/14/2015 University of Washington, Winter 2015 41
– Improve public health system – Activist led – Scandinavian participatory design and action research
– Mozambique, India, Vietnam, Cuba – Technical and political challenges
1/14/2015 University of Washington, Winter 2015 42
1/14/2015 University of Washington, Winter 2015 43
1/14/2015 University of Washington, Winter 2015 44
1/14/2015 University of Washington, Winter 2015 45
1/14/2015 University of Washington, Winter 2015 46
1/14/2015 University of Washington, Winter 2015 47
1/14/2015 University of Washington, Winter 2015 48
1/14/2015 University of Washington, Winter 2015 49
1/14/2015 University of Washington, Winter 2015 50
1/14/2015 University of Washington, Winter 2015 51
1/14/2015 University of Washington, Winter 2015 52
1/14/2015 University of Washington, Winter 2015 53
1/14/2015 University of Washington, Winter 2015 54
1/14/2015 University of Washington, Winter 2015 55
1/14/2015 University of Washington, Winter 2015 56
1/14/2015 University of Washington, Winter 2015 57
1/14/2015 University of Washington, Winter 2015 58
1/14/2015 University of Washington, Winter 2015 59
1/14/2015 University of Washington, Winter 2015 60