Computational Tools Avoidant Restrictive Food Intake Disorder - - PowerPoint PPT Presentation

computational tools
SMART_READER_LITE
LIVE PREVIEW

Computational Tools Avoidant Restrictive Food Intake Disorder - - PowerPoint PPT Presentation

Introduction Computational Tools Avoidant Restrictive Food Intake Disorder (ARFID), colloquially understood to Improve Healthy as extreme picky eating, is an eating and Pleasurable disorder characterized by highly selective eating


slide-1
SLIDE 1

Computational Tools to Improve Healthy and Pleasurable Eating in Young Children

Introduction

Avoidant Restrictive Food Intake Disorder (ARFID), colloquially understood as “extreme picky eating,” is an eating disorder characterized by highly selective eating habits, disturbed feeding patterns,

  • r both. Because ARFID is such a new and

broad diagnosis, not much is understood about its diverse manifestations or the most effective methods of diagnosis and treatment.

Team: Ellen Mines, Clara Savchik, Michelle Huang, Tzu-Chun Hsieh Project Managers:Youngkyung Kim, Alexander Breslav, Julia Nicholas Project Leads: Guillermo Sapiro, Nancy Zucker

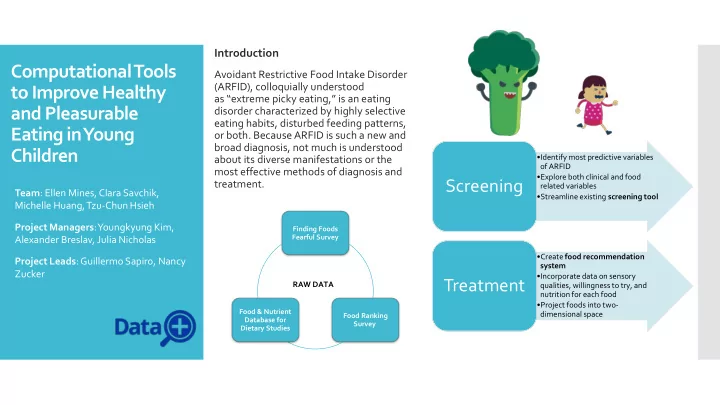
Finding Foods Fearful Survey Food Ranking Survey Food & Nutrient Database for Dietary Studies

RAW DATA

  • Identify most predictive variables
  • f ARFID
  • Explore both clinical and food

related variables

  • Streamline existing screening tool

Screening

  • Create food recommendation

system

  • Incorporate data on sensory

qualities, willingness to try, and nutrition for each food

  • Project foods into two-

dimensional space

Treatment

slide-2
SLIDE 2

Random Forest

  • Goal: Identify the best variable

predictors of ARFID

  • Clinical and behavioral

subscales (CAST, CEBQ, PFQ, SDQ)

  • Various food preferences

Future Work

  • Create faster and more streamlined

screening process for ARFID doctor consultation

  • Improve accuracy

ARFID Screening

Clinical and Behavioral Scales, model accuracy = 70% Food Preferences, model accuracy = 64%

Confusion Matrix (Average)

Recall = 0.688, precision = 0.698 , f1 = 0.688 Macro-Average: Recall = 0.51, precision = 0.54, f1 = 0.47

Confusion Matrix

slide-3
SLIDE 3

Food Exploration Tool

  • Each point on the scatterplot represents a food
  • Positioned based on picky eaters’ ratings of how sweet, sour, salty,

chewy, and crunchy the food is

  • Highlight points by category
  • Options to display nutrition information and/or show food

recommendations

Future Work

  • Create a mobile application for more convenient use of the food

exploration system Link: http://my- food- exploration.s3- website-us- west- 1.amazonaws.c

  • m/

Goal: Recommend new foods to children

based on “similar picky children” eat. Recommendation system

  • Categorizing Methods
  • perception, human behavior, nutrition
  • Clustering
  • Dimension reduction: PCA, t-SNE
  • Clustering methods: K-means, GMM, SOM
  • Heat Map
  • Distance between food based on experience of trying

ARFID Treatment

Ice cream Pudding Yogurt Eggs

slide-4
SLIDE 4

Appendix: Heat Map for meat

slide-5
SLIDE 5

Food Preference Variable Index