
SLIDE 1
Combined Trust-Fund Income and Outgo: Projections from March 2008 - - PowerPoint PPT Presentation
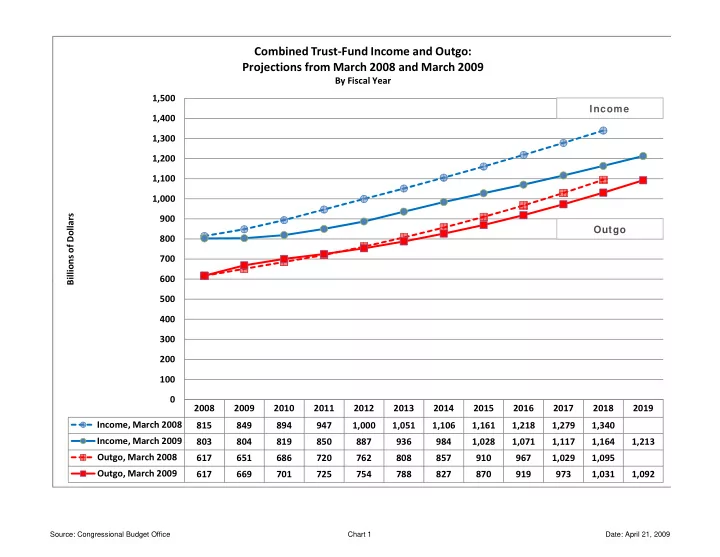
Combined Trust-Fund Income and Outgo: Projections from March 2008 and March 2009 By Fiscal Year 1,500 Income 1,400 1,300 1,200 1,100 1,000 Billions of Dollars 900 Outgo 800 700 600 600 B 500 400 300 200 100 0 2008 2009 2010