com puter vision
play

Com puter Vision Extraction of scene content from images and video - PDF document

Com puter Vision Extraction of scene content from images and video Traditional applications in robotics and control Com puter Vision and E.g., driver safety Object Recognition More recently in film and television E.g., ad


  1. Com puter Vision � Extraction of scene content from images and video � Traditional applications in robotics and control Com puter Vision and – E.g., driver safety Object Recognition � More recently in film and television – E.g., ad insertion � Digital images now being used in many fields Prof. Daniel Huttenlocher 2 Com puter Vision Research Areas Today’s Overview � Commonly broken down according to � Focus on some mid- and high-level vision degree of abstraction from image problems and techniques � Illustrate some computer vision algorithms – Low-level: mapping from pixels to pixels • Edge detection, feature detection, stereopsis, and applications optical flow � Segmentation and recognition because of – Mid-level: mapping from pixels to regions potential utility for analyzing images • Segmentation, recovering 3d structure from gathered in the laboratory or the field motion – Cover basic techniques rather than particular – High-level: mapping from pixels and regions to applications abstract categories • Recognition, classification, localization 3 4 I m age Segm entation 
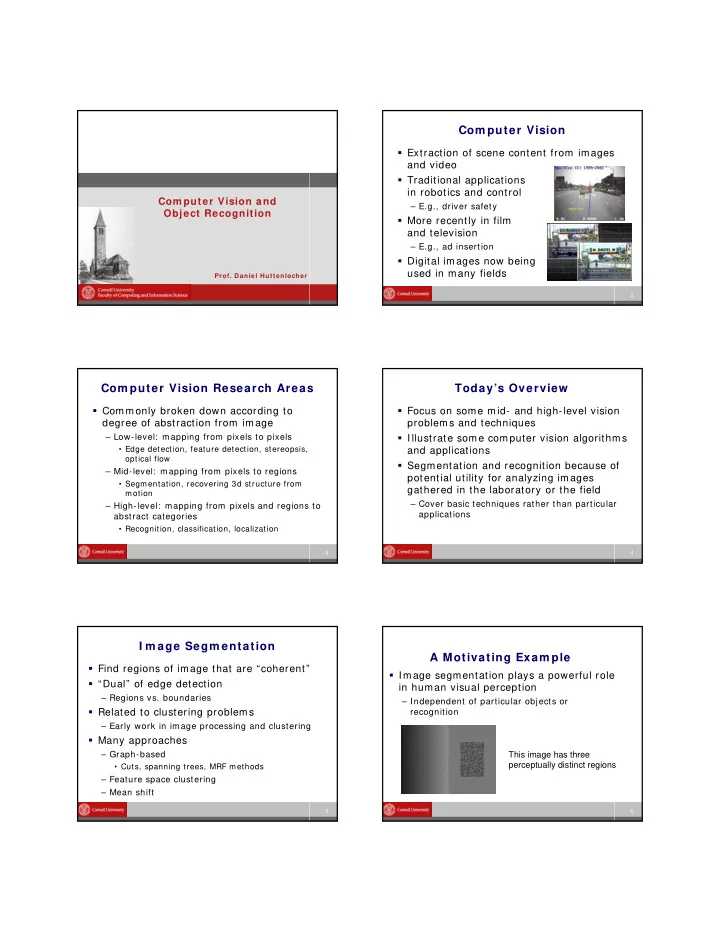
A Motivating Exam ple � Find regions of image that are “coherent” � Image segmentation plays a powerful role � “Dual” of edge detection in human visual perception – Regions vs. boundaries – Independent of particular objects or � Related to clustering problems recognition – Early work in im age processing and clustering � Many approaches – Graph-based This image has three perceptually distinct regions • Cuts, spanning trees, MRF methods – Feature space clustering – Mean shift 5 6

  2. I m portant Characteristics Graph Based Form ulation � G=(V,E) with vertices corresponding to pixels � Efficiency and edges connecting neighboring pixels – Run in time essentially linear in the number of image pixels • With low constant factors 4-connected or 8-conneted • E.g., compared to edge detection � Understandable output � Weight of edge is magnitude of intensity – Way to describe what algorithm does difference between connected pixels • E.g., Canny edge operator and step edge plus noise � A segmentation , S , is a partition of V such � Not purely local that each C ∈ S is connected – Perceptually im portant 7 8 Motivating Exam ple MST Based Approaches � Purely local criteria are � Graph-based representation inadequate – Nodes corresponding to pixels, edge weights are intensity difference between connected pixels – Difference along border between � Compute minimum spanning tree (MST) A and B is less than differences within C – Cheapest way to connect all pixels into single component or “region” � Selection criterion � Criteria based on piecewise A B C – Remove certain MST edges to form components constant regions are • Fixed threshold inadequate • Threshold based on neighborhood – Will arbitrarily split A into − How to find neighborhood subparts 9 10 Com ponent Measure Measuring Com ponent Difference � Don’t consider just local edge weights in � Let internal difference of a component be constructing MST maximum edge weight in its MST – Consider properties of two com ponents being Int(C) = max e ∈ MST(C,E) w(e) merged when adding an edge – Smallest weight such that all pixels of C are � Kruskal’s MST algorithm adds edges from connected by edges of at most that weight lowest to highest weight � Let difference between two components be – Only if edges connect distinct components minimum edge weight connecting them � Apply criterion based on components to Dif(C 1, C 2 ) = min vi ∈ C 1, vj ∈ C 2 w((v i, v j )) further filter added edges – Note: infinite if there is no such edge – Form of criterion lim ited by considering edges weight ordered 11 12

  3. Regions Found by this Approach Closely Related Problem s Hard � What appears to be a slight change – Make Dif be quantile instead of min k-th vi ∈ C 1, vj ∈ C 2 w((v i, v j )) – Desirable for addressing “cheap path” problem of merging based on one low cost edge A B C � Makes problem NP hard � Three main regions plus a few small ones – Reduction from min ratio cut � Why the algorithm stops growing these • Ratio of “capacity” to “demand” between nodes – Weight of edges between A and B large wrt max � Other methods that we will see are also weight MST edges of A and of B NP hard and approximated in various ways – Weight of edges between B and C large wrt max weight MST edge of B (but not of C) 13 14 Som e Exam ple Segm entations Sim ple Object Exam ples k=300 320 components larger than 10 k=200 323 components larger than 10 15 16 Monochrom e Exam ple Beyond Grid Graphs � Components locally connected (grid graph) � Image segmentation methods using affinity (or cost) matrices – Sometimes not desirable – For each pair of vertices v i ,v j an associated weight w ij • Affinity if larger when vertices more related • Cost if larger when vertices less related – Matrix W= [ w ij ] of affinities or costs • W is large, avoid constructing explicitly • For images affinities tend to be near zero except for pixels that are nearby − E.g., decrease exponentially with distance • W is sparse 17 18

  4. Cut Based Techniques Norm alized Cuts � For costs, natural to consider minimum � A number of normalization criteria have cost cuts been proposed � One that is commonly used – Removing edges with smallest total cost, that cut graph in two parts cut(A,B) cut(A,B) – Graph only has non-infinite-weight edges + Ncut(A,B) = assoc(A,V) assoc(B,V) � For segmentation, recursively cut resulting components � Where cut(A,B) is standard definition – Question of when to stop ∑ i ∈ A,j ∈ B w ij � Problem is that cuts tend to split off small � And assoc(A,V) = ∑ j ∑ i ∈ A w ij components 19 20 Com puting Norm alized Cuts Approxim ating Norm alized Cuts � Has been shown this is equivalent to an � Integer programming problem NP hard integer programming problem, minimize – Instead simply solve continuous (real-valued) y T (D-W)y version – relaxation method – This corresponds to finding second smallest y T D y eigenvector of � Subject to the constraint that y i ∈ { 1,b} (D-W)y i = λ i Dy i and y T D1= 0 � Widely used method – Where 1 vector of all 1’s – Works well in practice � W is the affinity matrix • Large eigenvector problem, but sparse matrices � D is the degree matrix (diagonal) • Often resolution reduce images, e.g, 100x100 D(i,i) = ∑ j w ij – But no longer clearly related to cut problem 21 22 Norm alized Cut Exam ples Spectral Methods � Eigenvectors of affinity and normalized affinity matrices � Widely used outside computer vision for graph-based clustering – Link structure of web pages, citation structure of scientific papers – Often directed rather than undirected graphs 23 24

  5. Segm entation Som e Segm entation References � Many other methods � J. Shi and J. Malik, “Normalized Cuts and Image Segmentation,” IEEE Transactions on Pattern Analysis and – Graph-based techniques such as the ones Machine Intelligence ,vol. 22, no. 8, pp. 888-905, 2000. illustrated here have been most widely used and successful � P. Felzenszwalb and D. Huttenlocher, “Efficient Graph Based Image Segmentation,” International Journal of – Techniques based on Markov Random Field Computer Vision , vol. 59, no. 2, pp. 167-181, 2004. (MRF) models have underlying statistical model � D. Comaniciu and P. Meer, “Mean shift: a robust approach • Relatively widespread use for medical image toward feature space analysis,” IEEE Transactions on segmentation problems Pattern Analysis and Machine Intelligence , vol. 24, no. 4, pp. 603-619, 2002. – Perhaps most widely used non-graph-based method is simple local iterative update procedure called Mean Shift 25 26 Recognition Recognizing Specific Objects � Specific objects � Approaches tend to be based on geometric properties of the objects – Much of the history of object recognition has been focused on recognizing specific objects in – Comparing edge maps: Hausdorff matching images – Comparing sparse features extracted from • E.g., a particular building, painting, etc. images: SIFT-based matching � Generic categories – More recently focus has been on generic categories of objects rather than specific individuals • E.g., faces, cars, motorbikes, etc. 27 28 Hausdorff Distance Distance Transform Definition � Set of points, P, some distance ⎟⎜ • ⎟⎜ � Classical definition D P (x) = min y ∈ P ⎟⎜ x - y ⎟⎜ – Directed distance (not symmetric) • h(A,B) = max a ∈ A min b ∈ B ⎟⎜ a-b ⎟⎜ – For each location x distance to nearest y in P – Distance (symm etry) – Think of as cones rooted at each point of P • H(A,B) = max(h(A,B), h(B,A)) � Commonly computed on a grid Γ using � Minimization term is simply a distance D P (x) = min y ∈ Γ ( ⎟⎜ x - y ⎟⎜ + 1 P (y) ) transform of B – Where 1 P (y) = 0 when y ∈ P, ∞ otherwise – h(A,B) = max a ∈ A D B (a) – Maxim ize over selected values of DT 2 1 2 3 1 0 1 2 � Not robust, single “bad match” dominates 1 0 1 2 2 1 2 3 29 30

Download Presentation
Download Policy: The content available on the website is offered to you 'AS IS' for your personal information and use only. It cannot be commercialized, licensed, or distributed on other websites without prior consent from the author. To download a presentation, simply click this link. If you encounter any difficulties during the download process, it's possible that the publisher has removed the file from their server.

Recommend


More recommend