
SLIDE 1
1 1
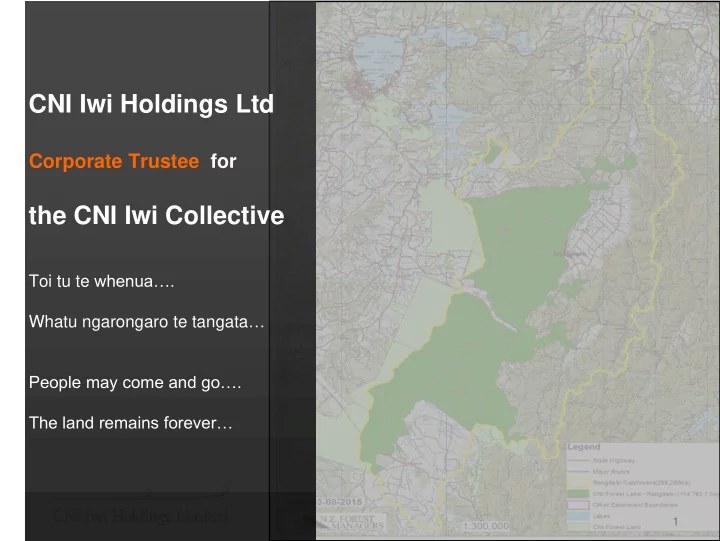
CNI Iwi Holdings Ltd
Corporate Trustee for
the CNI Iwi Collective
Toi tu te whenua…. Whatu ngarongaro te tangata… People may come and go…. The land remains forever…
CNI Iwi Holdings Ltd Corporate Trustee for the CNI Iwi Collective - - PowerPoint PPT Presentation
CNI Iwi Holdings Ltd Corporate Trustee for the CNI Iwi Collective Toi tu te whenua. Whatu ngarongaro te tangata People may come and go. The land remains forever 1 1 1. CNIIHL Context for interacting with Proposed Plan Change 10
1 1
Corporate Trustee for
Toi tu te whenua…. Whatu ngarongaro te tangata… People may come and go…. The land remains forever…
2
3 3
1900’s land confiscated / acquired by the Crown through illegal means 1980’s – 2005 Crown and Iwi tried various approaches to work towards settlement 2005 Iwi met to discuss a collective approach led by Te Ariki Tumu Te Heuheu 2008 CNI Iwi Collective Deed of Settlement signed
4 4
5 5
Ngāti Whare Ngāti Manawa Ngai Tūhoe Ngāti Tūwharetoa Ngāti Rangitihi Te Pumautanga o Te Arawa Raukawa Ngāti Whakaue
6 6
7
7
8
8
9
9
10
Crown Forest Licenses for up to 35 years
PC 10 Effect on CNI 3000Ha >$43m
10
11 11
signed
Management
Locks CNI out of land use change
stakeholders
12
Proposed Plan Change 10
13
14
15
Zone of competence Within-farm management comparisons
Beyond competence
Guessing Absolute N values Relative land uses e.g deer v dairy
WAY beyond competence “reference files” Plant-based land uses
16
Interpretation by technician 17
Overseer modelling
Detailed and precise inputs
single number
30% known uncertainty
+ errors in measurement (>20%) + variance in data input (>15%) + errors due to use at non-calibrated locations (>30%) Range = 0.33 – 2.33
Overseer modelling
Assumptions
Bias to a lower output Algorithms Secret Constants Not site-appropriate
18
19
20
21
21
22
RPS Policy WL 5B principles and considerations
sector average allocation Land Use Suitability
(a) Equity/Fairness, including intergenerational equity; X (b) Extent of the immediate impact; X (c) Public and private benefits and costs; X (d) Iwi land ownership and its status including any Crown obligation; X (e) Cultural values; X (f) Resource use efficiency; X (g) Existing land use; X (h) Existing on farm capital investment; and X (i) Ease of transfer of the allocation. X X 3/9 5/9
23
LR R2 Permitted – From 1 July 2017, the use of land for plantation forestry or bush/scrub
From 1 July 2017, the use of land for plantation forestry or bush/scrub in the Lake Rotorua groundwater catchment is a permitted activity, subject to the following conditions: (a)The land use remains in plantation forestry with no more than a two year interval between harvesting and replanting or upon harvesting the land is permanently retired; or (b)The land use remains in bush/scrub and is not used for grazing; and (c) There is no transfer of Nitrogen Discharge Allocations or Managed Reduction Offsets either to or from the property/farming enterprise.
Advice Note: 1 Plantation forestry and bush/scrub may be managed as part of a pastoral property/farming enterprise.
24
P 350 s32 report March 2004
Possible lost opportunity costs to agricultural landowners. There will be different costs to different landowners depending on the state of development on the property, the type of nutrient mitigation measures used on the property, and the long term goals of the landowner. As the provisions require no nett increase in nutrients from the catchment, agricultural activities can only intensify within current physical limits. The real issue with nutrient leaching is stock numbers. Increasing fertiliser application grows more grass, which allows more stock and urine patches, from which nitrogen and phosphorus leach. However, stock efficiency is currently limited. A dairy farm generally only captures 40% of nitrogen inputs in the product, the remainder is lost into the environment. Increasing fertiliser application is a waste of money if a property has achieved maximum stock
surveyed in the Rotorua Lakes, four farms (3 dairy farms and 1 sheep and beef farm) where above their economic optimum, where nutrient inputs could be reduced without compromising profitability. It was also found that many dairy farms are applying fertiliser to effluent disposal paddocks, where such applications are unnecessary. Efficient farming is to maximise profitability, which may not necessarily mean increasing productivity. Reducing costs may also achieve the same goal. Innovation and efficient intensification may result in financial savings to farmers (e.g. better targeting of fertiliser), while remaining within the nutrient envelope established by provisions in the plan. Land uses, other than traditional dairying or stock grazing, may be more economic in the medium to long
An indication of some possible works are use of a winter pad ($100,000 capital cost – based on 400 herd size, includes costs or pad, rails, gates, trough, fences, ancillary gear), wintering stock out of catchment ($90,000 per year – assumes 400 cows @ $15/head/week x 13 weeks, plus $15 per cow transport one way for 100 km), riparian retirement (fencing = $10 per metre, planting varies depending on the width of land and density of plantings).
2001 was $261 million. 21% of the total pasture land cover in Rotorua District is within the five lakes’ catchments that are currently below their TLI in Objective 10; Lakes Rotorua, Rotoiti, Rotoehu, Okareka and Okaro. This equates to $55 million. Note that it is not appropriate to use figures for the whole
provisions on the agricultural industry as wider market changes may impact the industry, landowners may chose to improve the efficiency of their
25
how Rule 11 was not implemented?
It is often argued by economists that markets are more efficient than centralised government decision making because they automatically gather information and ensure that supply and demand are balanced and resources allocated efficiently. However, this sort of argument cannot be applied to artificial markets such as those created for pollution rights since the need for monitoring and enforcement remains and is, in fact, arguably greater. For emissions trading to work properly, the regulator needs to know what emissions a company is making so as to check that it has sufficient permits. Too often inspection and verification does not happen.
https://www.uow.edu.au/~sharonb/STS300/market/rights/criteriainfo.html 26
27
28
Profit reduction in N leached