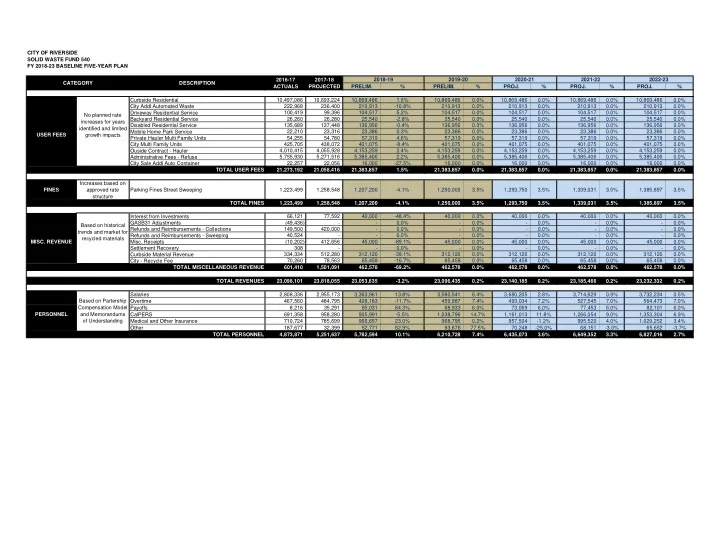

CITY OF RIVERSIDE SOLID WASTE FUND 540 FY 2018-23 BASELINE FIVE-YEAR PLAN 2016-17 2017-18 ACTUALS PROJECTED PRELIM. % PRELIM. % PROJ. % PROJ. % PROJ. % Curbside Residential 10,497,086 10,693,224 10,869,486 1.6% 10,869,486 0.0% 10,869,486 0.0% 10,869,486 0.0% 10,869,486 0.0% City Addl Automated Waste 222,968 236,400 210,913
- 10.8%
210,913 0.0% 210,913 0.0% 210,913 0.0% 210,913 0.0% Driveway Residential Service 100,419 99,396 104,517 5.2% 104,517 0.0% 104,517 0.0% 104,517 0.0% 104,517 0.0% Backyard Residential Service 26,260 26,280 25,540
- 2.8%
25,540 0.0% 25,540 0.0% 25,540 0.0% 25,540 0.0% Disabled Residential Service 135,689 137,448 136,956
- 0.4%
136,956 0.0% 136,956 0.0% 136,956 0.0% 136,956 0.0% Mobile Home Park Service 22,210 23,316 23,386 0.3% 23,386 0.0% 23,386 0.0% 23,386 0.0% 23,386 0.0% Private Hauler Multi Family Units 54,255 54,780 57,319 4.6% 57,319 0.0% 57,319 0.0% 57,319 0.0% 57,319 0.0% City Multi Family Units 425,705 438,072 401,075
- 8.4%
401,075 0.0% 401,075 0.0% 401,075 0.0% 401,075 0.0% Ouside Contract - Hauler 4,010,415 4,055,928 4,153,259 2.4% 4,153,259 0.0% 4,153,259 0.0% 4,153,259 0.0% 4,153,259 0.0% Administrative Fees - Refuse 5,755,930 5,271,516 5,385,406 2.2% 5,385,406 0.0% 5,385,406 0.0% 5,385,406 0.0% 5,385,406 0.0% City Sale Addl Auto Container 22,257 22,056 16,000
- 27.5%
16,000 0.0% 16,000 0.0% 16,000 0.0% 16,000 0.0% TOTAL USER FEES 21,273,192 21,058,416 21,383,857 1.5% 21,383,857 0.0% 21,383,857 0.0% 21,383,857 0.0% 21,383,857 0.0% FINES Increases based on approved rate structure Parking Fines Street Sweeping 1,223,499 1,258,548 1,207,200
- 4.1%
1,250,000 3.5% 1,293,750 3.5% 1,339,031 3.5% 1,385,897 3.5% TOTAL FINES 1,223,499 1,258,548 1,207,200
- 4.1%
1,250,000 3.5% 1,293,750 3.5% 1,339,031 3.5% 1,385,897 3.5% Interest from Investments 66,121 77,592 40,000
- 48.4%
40,000 0.0% 40,000 0.0% 40,000 0.0% 40,000 0.0% GASB31 Adjustments (49,436)
- 0.0%
- 0.0%
- 0.0%
- 0.0%
- 0.0%
Refunds and Reimbursements - Collections 149,500 420,000
- 0.0%
- 0.0%
- 0.0%
- 0.0%
- 0.0%
Refunds and Reimbursements - Sweeping 40,524
- 0.0%
- 0.0%
- 0.0%
- 0.0%
- 0.0%
- Misc. Receipts
(10,202) 412,656 45,000
- 89.1%
45,000 0.0% 45,000 0.0% 45,000 0.0% 45,000 0.0% Settlement Recovery 308
- 0.0%
- 0.0%
- 0.0%
- 0.0%
- 0.0%
Curbside Material Revenue 334,334 512,280 312,120
- 39.1%
312,120 0.0% 312,120 0.0% 312,120 0.0% 312,120 0.0% City - Recycle Fee 70,260 78,563 65,458
- 16.7%
65,458 0.0% 65,458 0.0% 65,458 0.0% 65,458 0.0% TOTAL MISCELLANEOUS REVENUE 601,410 1,501,091 462,578
- 69.2%
462,578 0.0% 462,578 0.0% 462,578 0.0% 462,578 0.0% TOTAL REVENUES 23,098,101 23,818,055 23,053,635
- 3.2%
23,096,435 0.2% 23,140,185 0.2% 23,185,466 0.2% 23,232,332 0.2% Salaries 2,808,336 2,955,173 3,363,961 13.8% 3,580,541 6.4% 3,680,205 2.8% 3,714,629 0.9% 3,732,234 0.5% Overtime 467,560 484,795 428,183
- 11.7%
459,987 7.4% 493,034 7.2% 527,545 7.0% 564,473 7.0% Payoffs 8,216 35,291 65,031 84.3% 68,933 6.0% 73,069 6.0% 77,453 6.0% 82,101 6.0% CalPERS 691,358 958,280 905,991
- 5.5%
1,038,796 14.7% 1,161,013 11.8% 1,266,054 9.0% 1,353,304 6.9% Medical and Other Insurance 710,724 785,699 966,657 23.0% 968,795 0.2% 957,504
- 1.2%
995,520 4.0% 1,029,252 3.4% Other 187,677 32,399 52,771 62.9% 93,676 77.5% 70,248
- 25.0%
68,151
- 3.0%
65,652
- 3.7%
TOTAL PERSONNEL 4,873,871 5,251,637 5,782,594 10.1% 6,210,728 7.4% 6,435,073 3.6% 6,649,352 3.3% 6,827,016 2.7% PERSONNEL Based on Partership Compensation Model and Memorandums
- f Understanding
- MISC. REVENUE
Based on historical trends and market for recycled materials CATEGORY DESCRIPTION USER FEES No planned rate increases for years identified and limited growth impacts 2018-19 2019-20 2020-21 2021-22 2022-23